TECHNICAL ASSET FINGERPRINT
9c9e32dd3cb9e0e4d0a5a1d2
Click to view fullscreen
Press ESC or click to close
FOUND IN PAPERS
EXPERT: healer-alpha-free VERSION 1
RUNTIME: free/openrouter/healer-alpha
INTEL_VERIFIED
## Line Chart: Accuracy Comparison of Three AI Models Across Mathematical Topics
### Overview
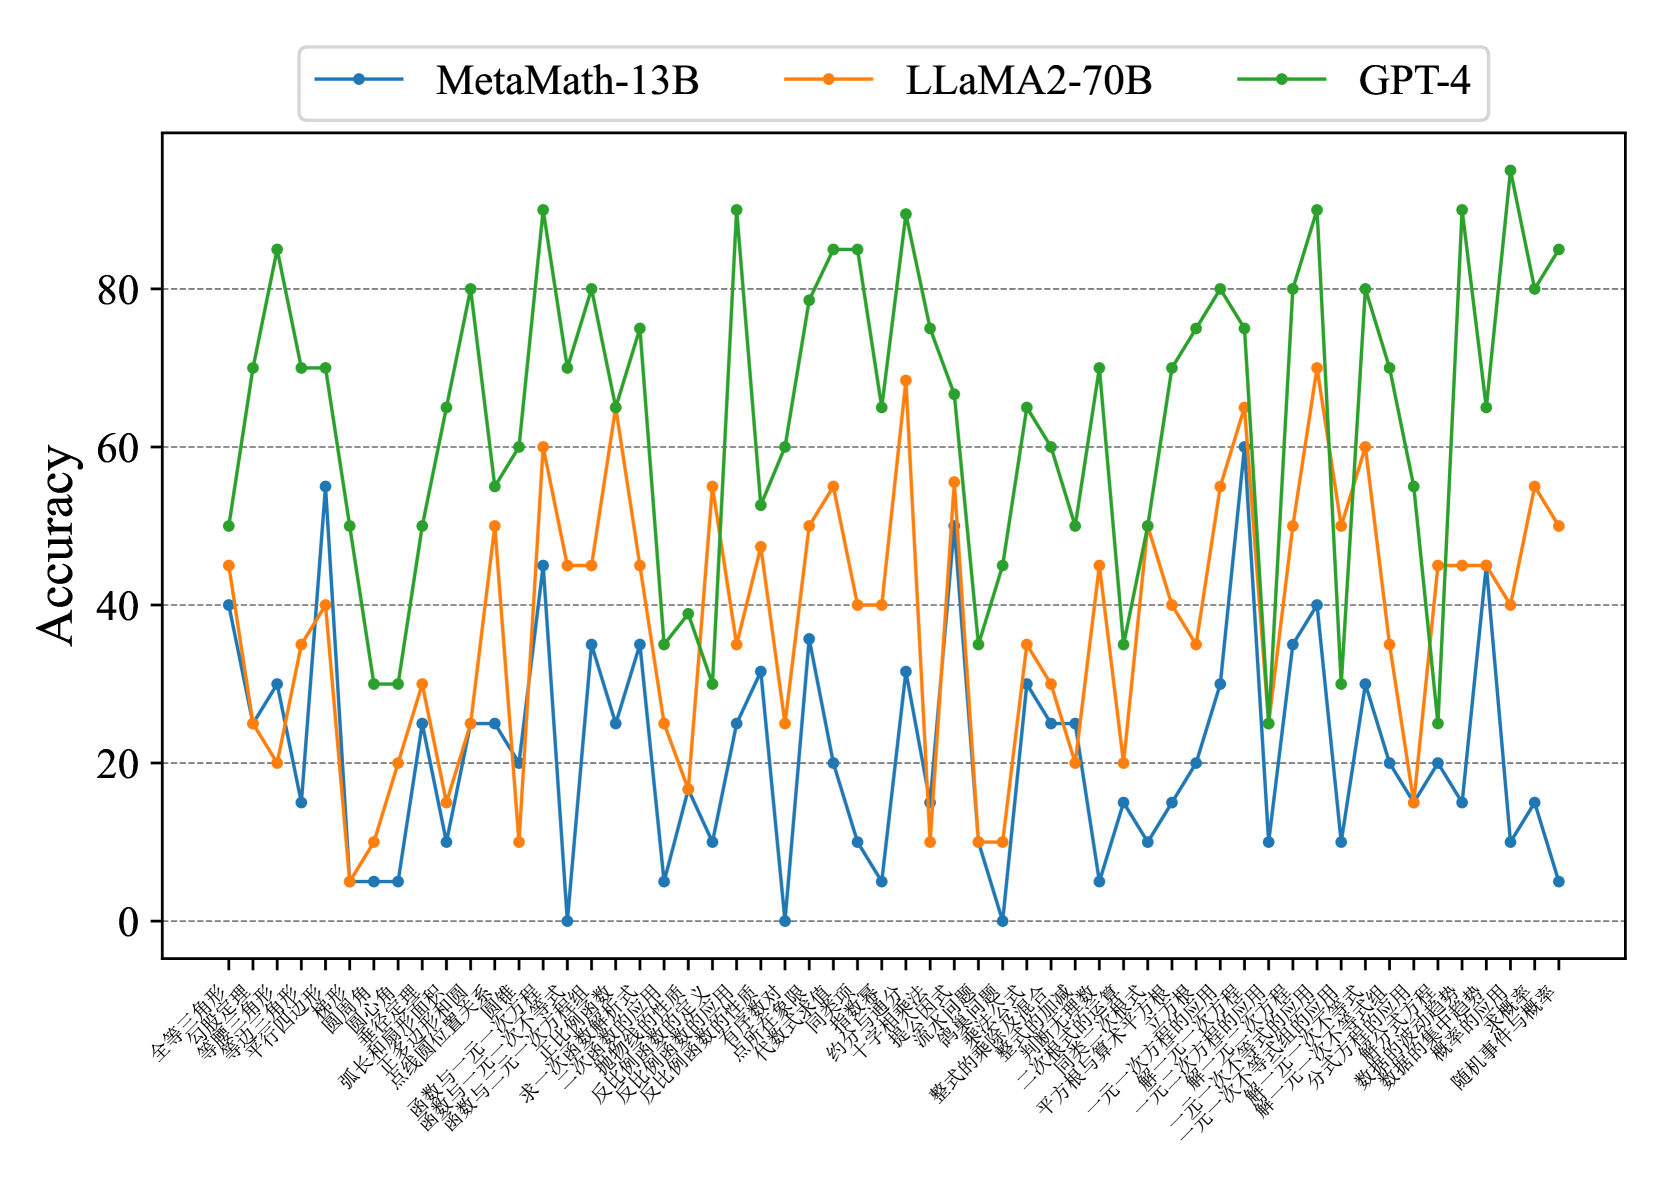
This image is a line chart comparing the accuracy performance of three large language models (LLMs) across a wide range of mathematical topics. The chart plots "Accuracy" on the y-axis against 40 distinct mathematical categories on the x-axis. The three models compared are MetaMath-13B, LLaMA2-70B, and GPT-4. The data reveals significant variability in performance both between models and across different mathematical domains.
### Components/Axes
* **Chart Type:** Multi-line chart with markers.
* **Y-Axis:**
* **Label:** "Accuracy" (written vertically on the left side).
* **Scale:** Linear scale from 0 to approximately 95.
* **Major Grid Lines:** Horizontal dashed lines at intervals of 20 (0, 20, 40, 60, 80).
* **X-Axis:**
* **Label:** None explicitly stated. The axis consists of 40 categorical labels representing mathematical topics.
* **Labels (Transcribed from Chinese, with English translation):**
1. 全等三角形 - Congruent Triangles
2. 等腰三角形 - Isosceles Triangles
3. 等边三角形 - Equilateral Triangles
4. 平行四边形 - Parallelograms
5. 圆周角 - Inscribed Angle
6. 圆心角 - Central Angle
7. 弧长和扇形面积 - Arc Length and Sector Area
8. 点线面位置关系 - Positional Relationships of Points, Lines, and Planes
9. 函数与一元一次方程 - Functions and Linear Equations in One Variable
10. 函数与一元二次方程 - Functions and Quadratic Equations in One Variable
11. 函数与二元一次方程组 - Functions and Systems of Linear Equations in Two Variables
12. 求一次函数解析式 - Finding the Analytic Expression of a Linear Function
13. 二次函数的性质 - Properties of Quadratic Functions
14. 正比例函数的应用 - Application of Direct Proportional Functions
15. 反比例函数的定义 - Definition of Inverse Proportional Functions
16. 反比例函数的性质 - Properties of Inverse Proportional Functions
17. 反比例函数的应用 - Application of Inverse Proportional Functions
18. 有理数的乘方 - Exponentiation of Rational Numbers
19. 代数式求值 - Evaluating Algebraic Expressions
20. 同底数幂的乘法 - Multiplication of Powers with the Same Base
21. 约分与通分 - Reduction and Reduction to a Common Denominator
22. 十字相乘法 - Cross Multiplication Method
23. 提公因式法 - Factoring by Taking out the Common Factor
24. 分组分解法 - Factoring by Grouping
25. 整式的乘法 - Multiplication of Polynomials
26. 整式的加减 - Addition and Subtraction of Polynomials
27. 二次根式的性质 - Properties of Quadratic Radicals
28. 平方根与算术平方根 - Square Root and Arithmetic Square Root
29. 一元一次方程的根应用 - Application of Roots of Linear Equations in One Variable
30. 解一元二次方程 - Solving Quadratic Equations in One Variable
31. 一元二次方程的根应用 - Application of Roots of Quadratic Equations in One Variable
32. 解一元一次不等式 - Solving Linear Inequalities in One Variable
33. 解一元一次不等式组 - Solving Systems of Linear Inequalities in One Variable
34. 解二元一次方程组 - Solving Systems of Linear Equations in Two Variables
35. 分式方程的应用 - Application of Fractional Equations
36. 数据的收集与整理 - Data Collection and Organization
37. 数据的集中趋势 - Central Tendency of Data
38. 概率的求法 - Methods of Calculating Probability
39. 随机事件与概率 - Random Events and Probability
40. (The 40th label is partially cut off but appears to be a continuation of the probability topic).
* **Legend:**
* **Position:** Top center, above the plot area.
* **Items:**
* **MetaMath-13B:** Blue line with circular markers.
* **LLaMA2-70B:** Orange line with circular markers.
* **GPT-4:** Green line with circular markers.
### Detailed Analysis
**Trend Verification & Data Point Extraction (Approximate Values):**
The chart shows high volatility for all models. Below is an analysis of each series' trend and key points.
* **GPT-4 (Green Line):**
* **Overall Trend:** Consistently the highest-performing model, with accuracy mostly ranging between 60 and 95. It shows a jagged, "sawtooth" pattern with sharp peaks and valleys but maintains a high baseline.
* **Key Data Points (Approximate):**
* Peaks near or above 90: "函数与一元二次方程" (~90), "反比例函数的性质" (~90), "同底数幂的乘法" (~90), "整式的乘法" (~90), "解一元二次方程" (~90), "分式方程的应用" (~90), "概率的求法" (~95).
* Notable Valleys (still relatively high): "等腰三角形" (~70), "圆心角" (~50), "反比例函数的定义" (~30), "十字相乘法" (~35), "整式的加减" (~35), "平方根与算术平方根" (~50), "解一元一次不等式组" (~25).
* **LLaMA2-70B (Orange Line):**
* **Overall Trend:** Occupies the middle ground, with accuracy generally between 10 and 70. Its performance is also volatile but sits systematically below GPT-4 and often above MetaMath-13B.
* **Key Data Points (Approximate):**
* Peaks: "函数与一元二次方程" (~60), "反比例函数的性质" (~65), "同底数幂的乘法" (~55), "整式的乘法" (~70), "解一元二次方程" (~65), "分式方程的应用" (~60).
* Valleys: "等腰三角形" (~20), "圆心角" (~5), "反比例函数的定义" (~15), "十字相乘法" (~10), "整式的加减" (~10), "平方根与算术平方根" (~20), "解一元一次不等式组" (~15).
* **MetaMath-13B (Blue Line):**
* **Overall Trend:** Generally the lowest-performing model, with accuracy mostly between 0 and 55. It exhibits the most extreme volatility, with several points dropping to near 0 and a few spikes that approach or briefly surpass LLaMA2-70B.
* **Key Data Points (Approximate):**
* Notable Spikes: "平行四边形" (~55), "函数与一元一次方程" (~45), "求一次函数解析式" (~35), "整式的乘法" (~50), "解一元二次方程" (~60).
* Valleys at or near 0: "函数与二元一次方程组", "反比例函数的定义", "约分与通分", "整式的加减", "解一元一次不等式组".
### Key Observations
1. **Performance Hierarchy:** A clear and consistent hierarchy is visible: GPT-4 > LLaMA2-70B > MetaMath-13B across almost all topics.
2. **Topic Difficulty Correlation:** All three models show synchronized dips and peaks on certain topics, suggesting some mathematical areas are universally more challenging (e.g., "圆心角" - Central Angle, "反比例函数的定义" - Definition of Inverse Proportional Functions, "整式的加减" - Addition/Subtraction of Polynomials).
3. **Model-Specific Strengths:** MetaMath-13B shows surprising competence in specific geometry ("平行四边形" - Parallelograms) and algebra ("解一元二次方程" - Solving Quadratic Equations) topics, where its accuracy spikes significantly.
4. **Volatility:** The performance of all models is highly topic-dependent. No model demonstrates flat, consistent accuracy; mastery is domain-specific.
5. **Zero-Performance Points:** MetaMath-13B has multiple data points at or near 0% accuracy, indicating complete failure on those specific topics for the evaluated test set.
### Interpretation
This chart provides a granular diagnostic of LLM capabilities in mathematics, moving beyond aggregate scores. The data suggests:
* **Generalization vs. Specialization:** GPT-4 demonstrates robust generalization across a wide mathematical curriculum. In contrast, MetaMath-13B, despite its smaller size and specialized training, shows a "spiky" profile—it excels in narrow domains but fails completely in others, indicating potential gaps in its training data or reasoning generalization.
* **The "Curriculum" of Difficulty:** The synchronized performance dips reveal an implicit hierarchy of difficulty within middle/high school mathematics as perceived by these models. Foundational topics like definitions ("反比例函数的定义") and basic operations ("整式的加减") prove surprisingly difficult, possibly because they require precise, rule-based reasoning that LLMs can find challenging.
* **Implications for Use:** For reliable mathematical problem-solving, GPT-4 is the most dependable choice across the board. Using a model like MetaMath-13B would require careful human oversight and knowledge of its specific strengths and weaknesses. The chart acts as a capability map for selecting the right tool for a specific mathematical task.
* **Investigative Insight (Peircean):** The chart is an *index* of the models' internal knowledge structures and reasoning flaws. The valleys are not random; they point to specific conceptual hurdles (e.g., handling definitions, certain algebraic manipulations). The spikes in MetaMath-13B suggest its fine-tuning was highly effective for certain problem *types* but did not confer broad mathematical understanding. This visual data argues that "math accuracy" is not a monolithic skill but a constellation of competencies.
DECODING INTELLIGENCE...