## Chart: Proportion of Successful Rebuilds Over Time
### Overview
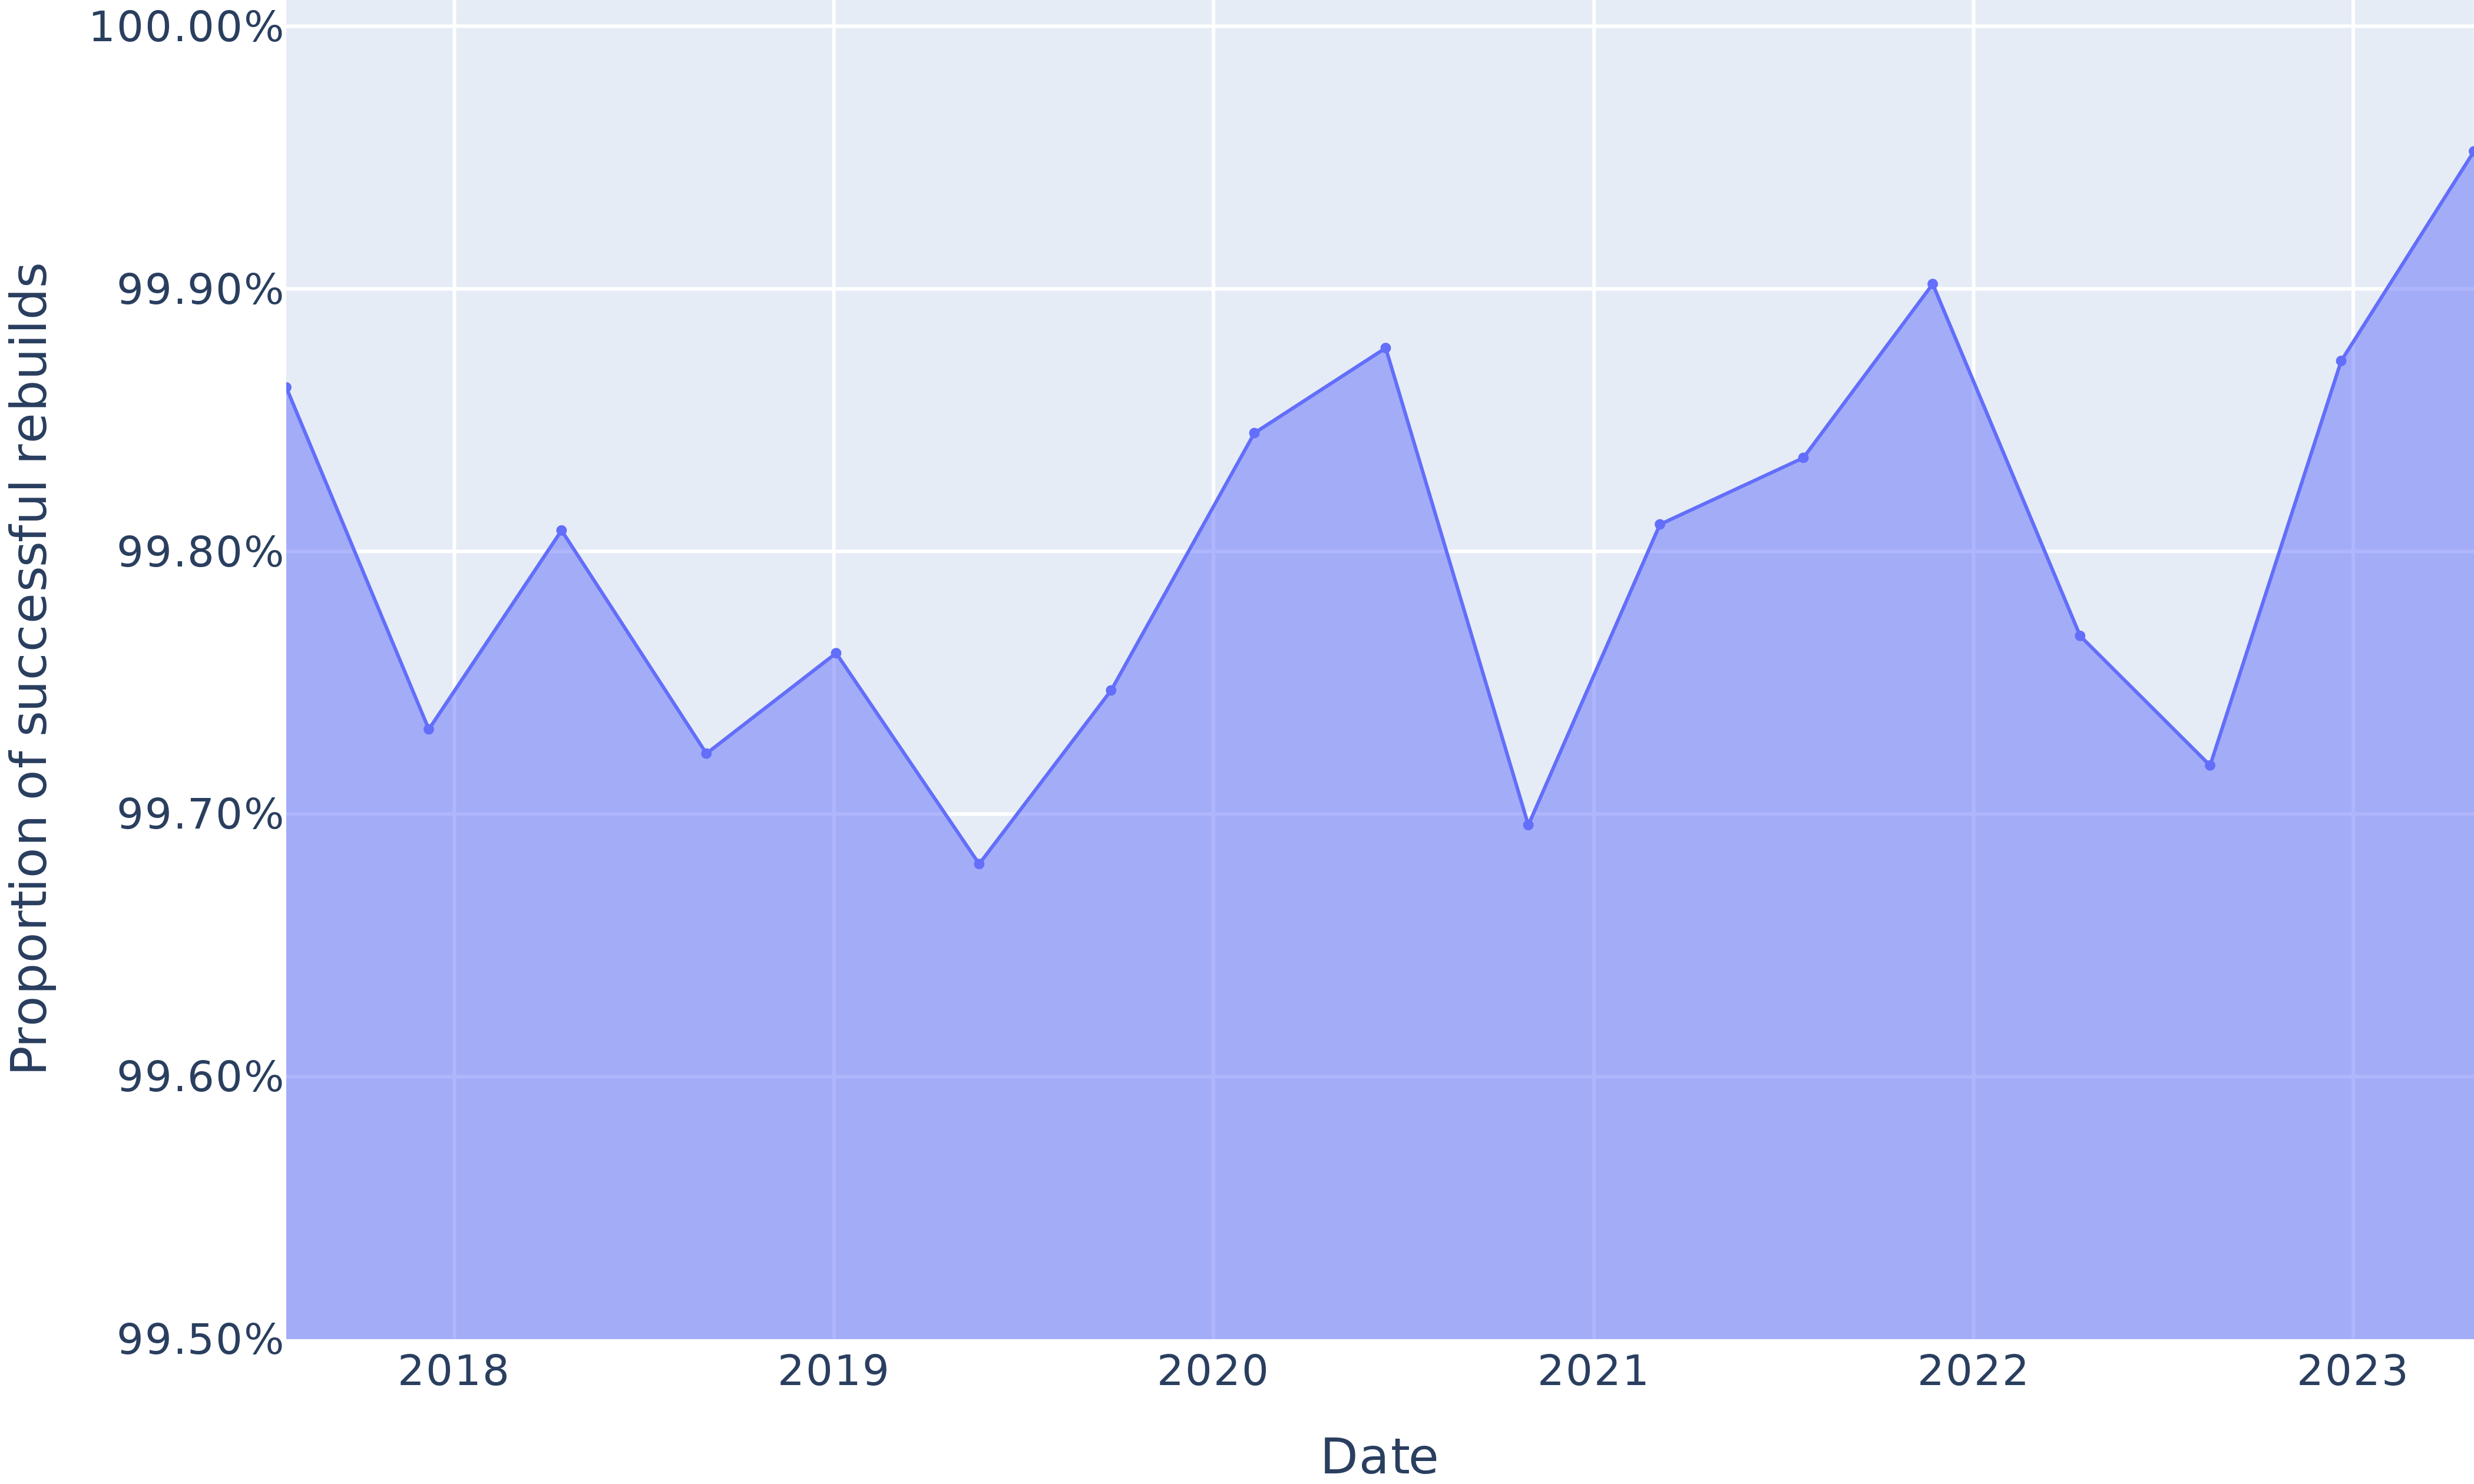
The image is a line chart showing the proportion of successful rebuilds over time, from 2018 to 2023. The y-axis represents the proportion of successful rebuilds, ranging from 99.50% to 100.00%. The x-axis represents the date, spanning from 2018 to 2023. The area under the line is shaded in blue.
### Components/Axes
* **X-axis:** Date, with labels for the years 2018, 2019, 2020, 2021, 2022, and 2023.
* **Y-axis:** Proportion of successful rebuilds, with labels for 99.50%, 99.60%, 99.70%, 99.80%, 99.90%, and 100.00%.
* **Data Series:** A single data series representing the proportion of successful rebuilds, plotted as a blue line with the area under the line shaded in blue.
### Detailed Analysis
The data series shows the proportion of successful rebuilds fluctuating between approximately 99.68% and 99.90% over the years.
* **2018:** Starts at approximately 99.86%, dips to 99.73% and rises to 99.81%.
* **2019:** Dips to approximately 99.72%, rises to 99.76%, and dips to 99.68%.
* **2020:** Rises to approximately 99.75%, then rises sharply to 99.85%.
* **2021:** Dips to approximately 99.70%, then rises to 99.81%.
* **2022:** Rises to approximately 99.83%, then rises sharply to 99.89%, then dips to 99.76%.
* **2023:** Dips to approximately 99.72%, then rises sharply to 99.87%, then rises to 99.97%.
### Key Observations
* The proportion of successful rebuilds generally fluctuates within a narrow range (99.68% to 99.90%).
* There is an overall upward trend in the proportion of successful rebuilds from 2018 to 2023.
* The highest proportion of successful rebuilds is observed in 2023, reaching approximately 99.97%.
* The lowest proportion of successful rebuilds is observed in 2019, reaching approximately 99.68%.
### Interpretation
The chart indicates a high level of reliability in the rebuild process, with the proportion of successful rebuilds consistently above 99.50%. The upward trend suggests continuous improvement or optimization of the rebuild process over the years. The fluctuations within the narrow range could be attributed to various factors such as software updates, hardware changes, or temporary system issues. The data suggests that the rebuild process is stable and becoming more reliable over time.