\n
## Line Chart: Proportion of Successful Rebuilds Over Time
### Overview
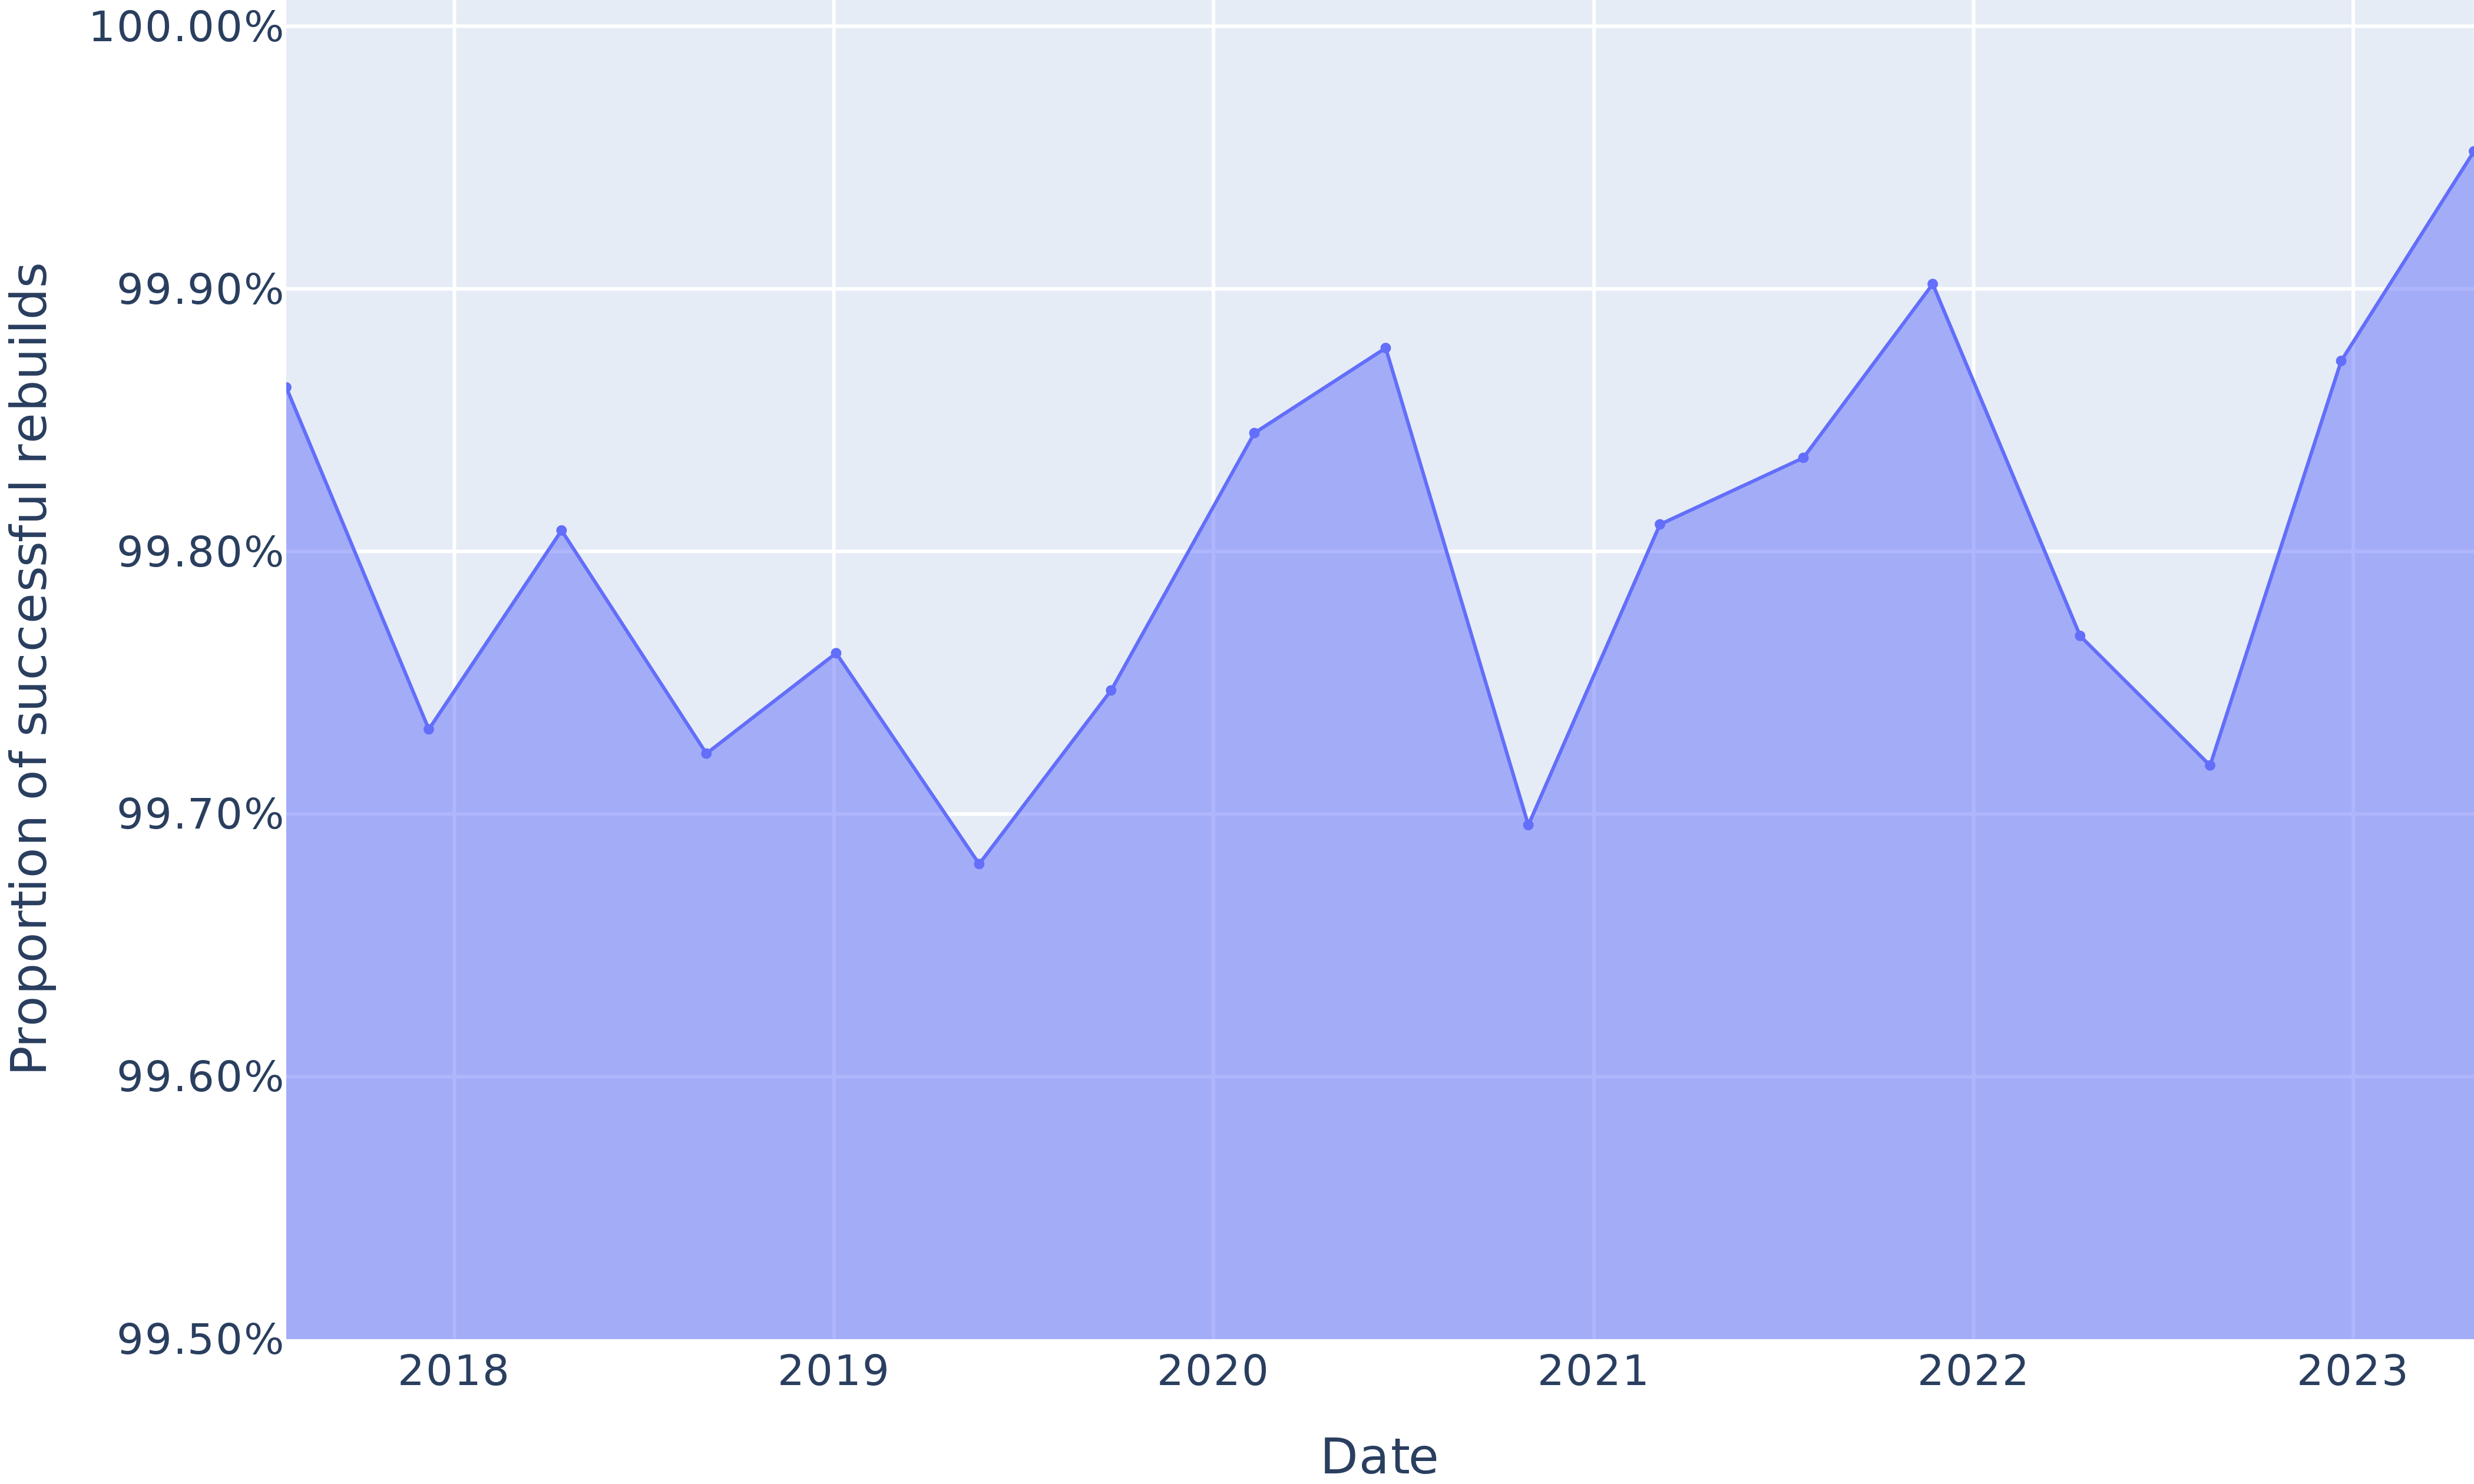
The image presents a line chart illustrating the proportion of successful rebuilds over a period from 2018 to 2023. The chart uses a single blue line to represent the trend, plotted against time on the x-axis and proportion on the y-axis. The background is a light blue gradient.
### Components/Axes
* **X-axis Title:** "Date"
* **Y-axis Title:** "Proportion of successful rebuilds"
* **Y-axis Scale:** Ranges from 99.50% to 100.00% with increments of 0.10%.
* **Data Series:** A single line representing the proportion of successful rebuilds.
* **Time Scale:** The x-axis displays years from 2018 to 2023.
### Detailed Analysis
The blue line generally fluctuates between approximately 99.70% and 99.90% throughout the observed period.
* **2018:** Starts at approximately 99.85%, dips to a low of around 99.72% and ends at approximately 99.78%.
* **2019:** Begins at approximately 99.78%, rises to around 99.82%, then declines to approximately 99.74%.
* **2020:** Starts at approximately 99.74%, increases to a peak of around 99.88%, and then decreases to approximately 99.82%.
* **2021:** Begins at approximately 99.82%, drops to a low of approximately 99.70%, and then rises to around 99.85%.
* **2022:** Starts at approximately 99.85%, increases to a peak of approximately 99.92%, and then declines to approximately 99.80%.
* **2023:** Begins at approximately 99.80% and rises to approximately 99.93%.
The line generally exhibits an upward trend from 2021 to 2023.
### Key Observations
* The lowest point on the chart appears to be around 99.70% in 2021.
* The highest point on the chart appears to be around 99.93% in 2023.
* The proportion of successful rebuilds remains consistently high, always above 99.50%.
* There is a noticeable increase in the proportion of successful rebuilds towards the end of the observed period (2022-2023).
### Interpretation
The data suggests a consistently high success rate for rebuilds over the period 2018-2023. The slight fluctuations likely represent normal variations in the rebuild process. The upward trend observed in the later years (2021-2023) could indicate improvements in the rebuild process, infrastructure, or testing procedures. The consistently high values suggest a robust and reliable system. The absence of significant dips or failures indicates a well-maintained and stable process. The data does not reveal the *cause* of the fluctuations, only that they exist. Further investigation would be needed to determine the factors influencing these variations.