## Line Graph: Proportion of Successful Rebuilds Over Time
### Overview
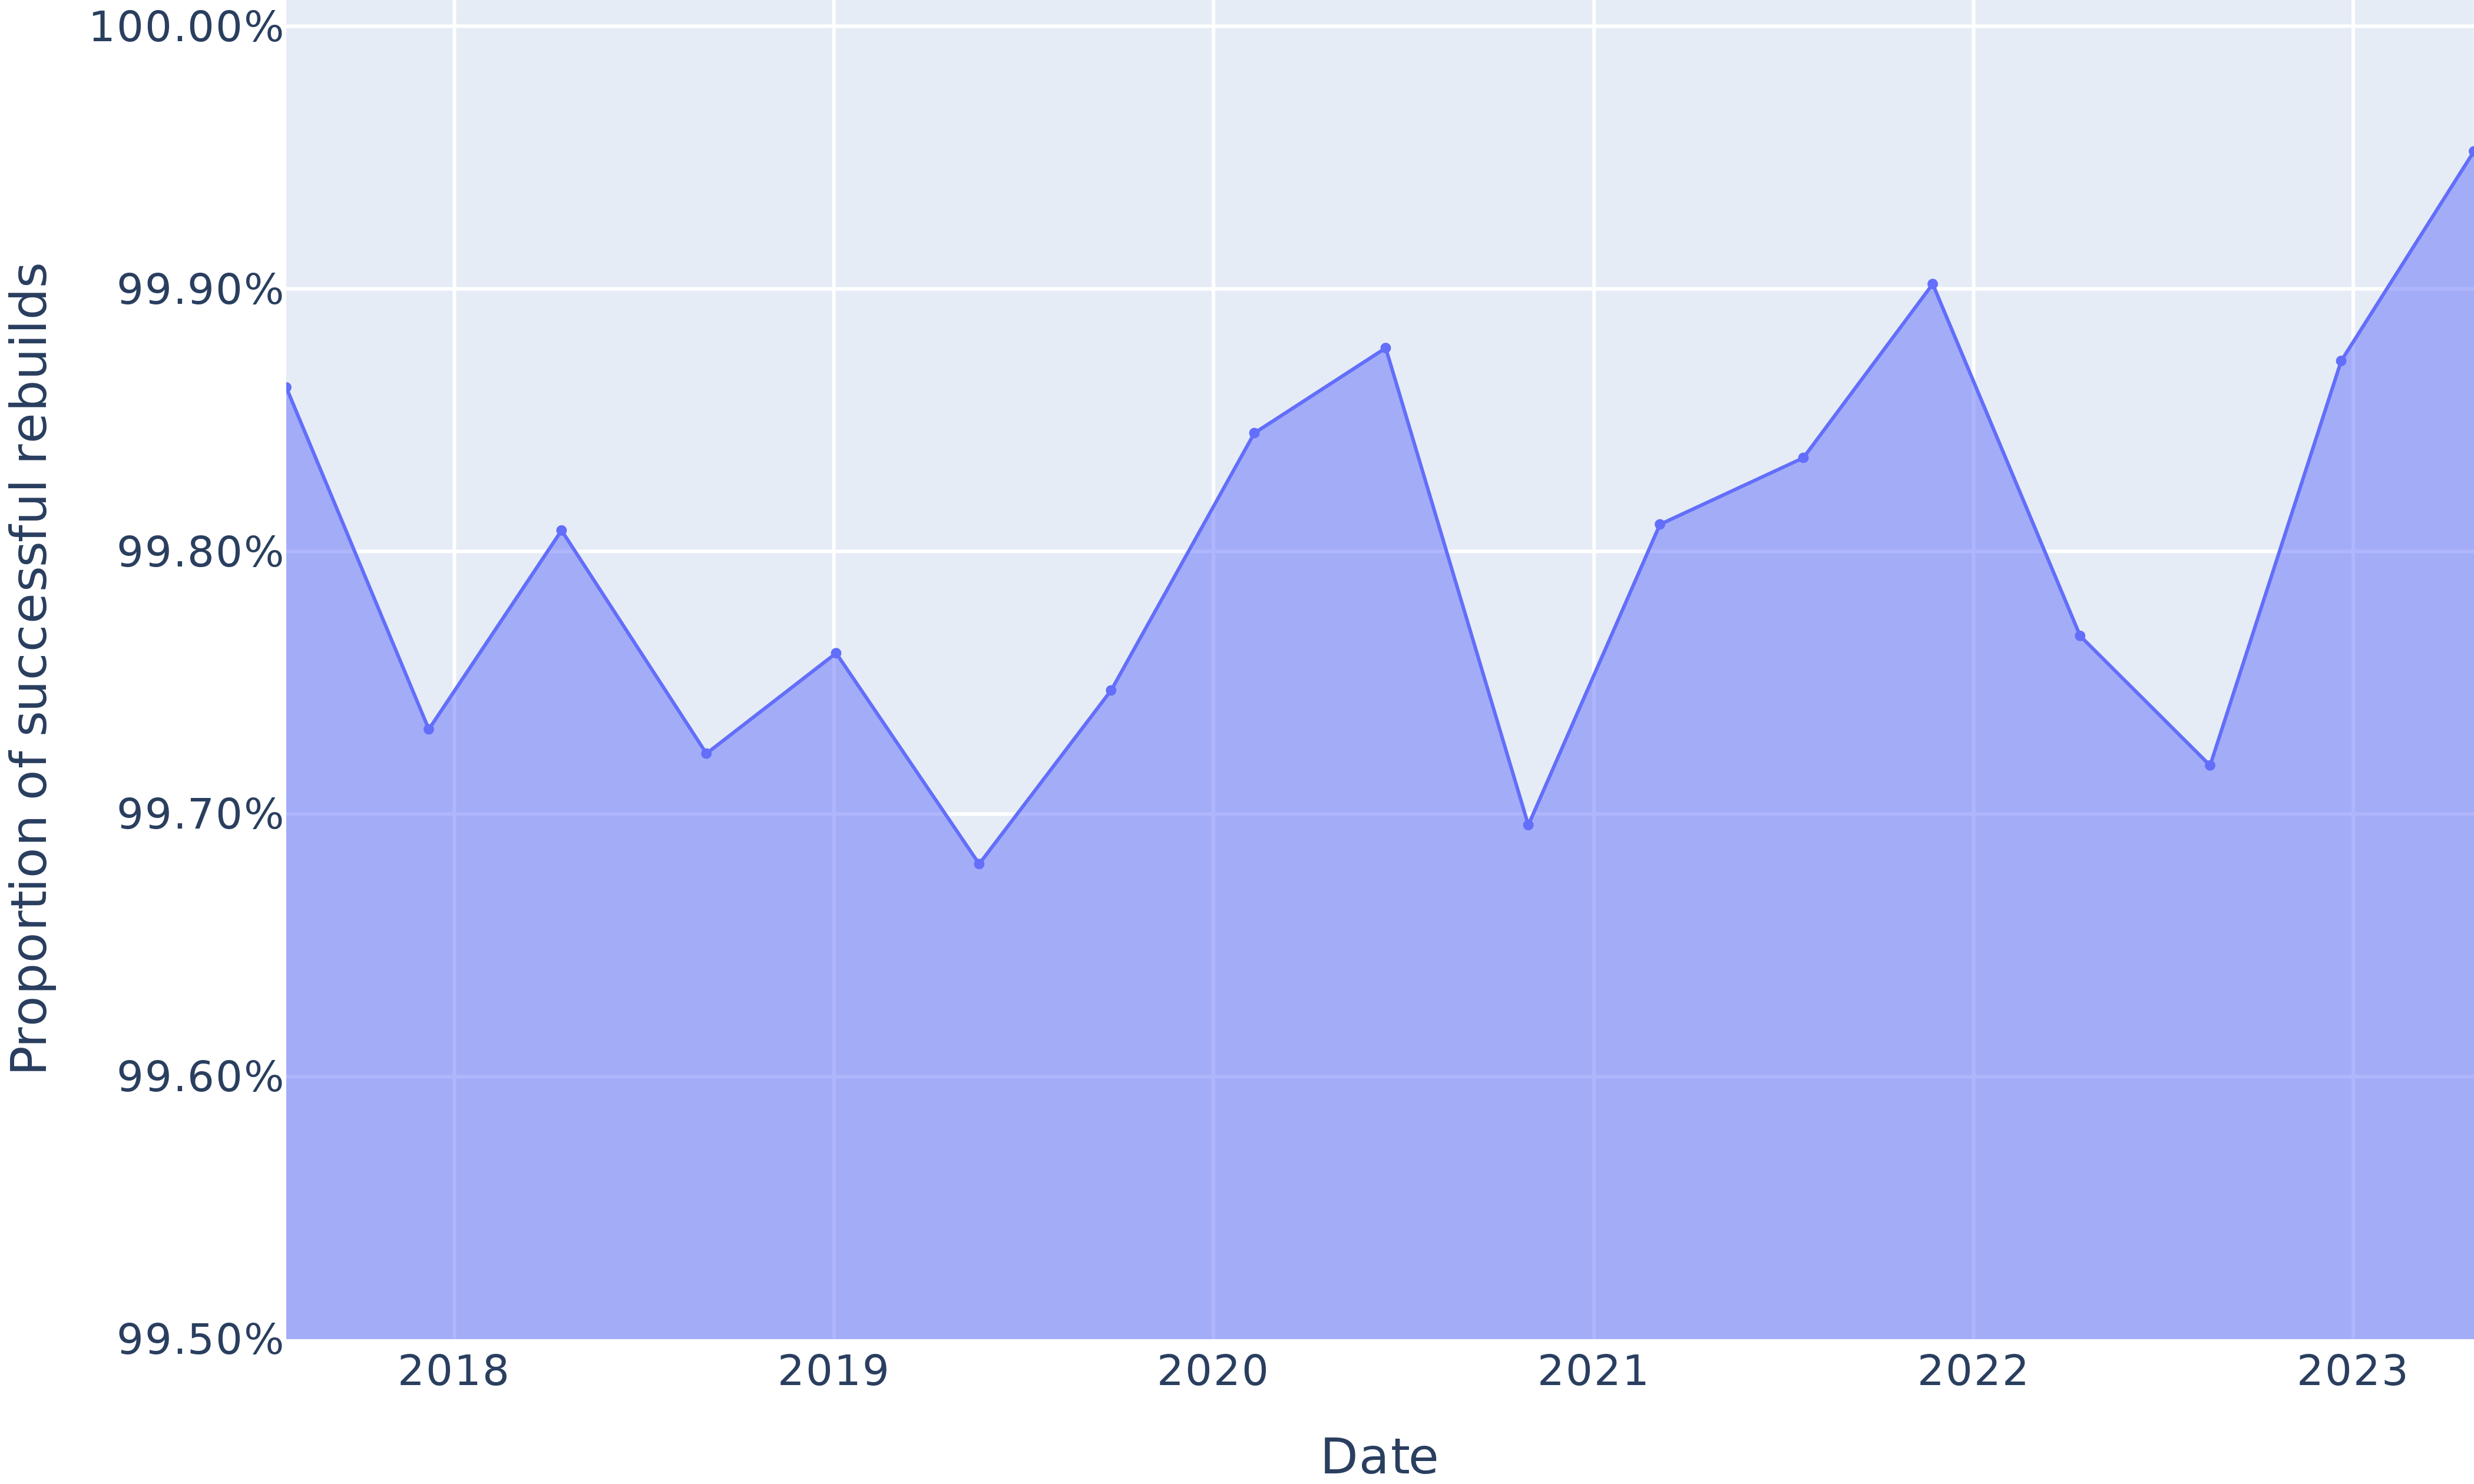
The image depicts a line graph illustrating the proportion of successful rebuilds as a percentage over a six-year period (2018–2023). The y-axis represents the proportion of successful rebuilds (ranging from 99.50% to 100.00%), while the x-axis represents the years. The blue line fluctuates between 99.70% and 99.90%, showing a general upward trend with periodic dips.
---
### Components/Axes
- **Y-Axis**:
- Label: "Proportion of successful rebuilds"
- Scale: 99.50% to 100.00% (in 0.01% increments)
- Units: Percentages
- **X-Axis**:
- Label: "Date"
- Scale: 2018 to 2023 (annual intervals)
- **Legend**:
- A single blue line representing the proportion of successful rebuilds.
---
### Detailed Analysis
- **Data Points**:
- **2018**: ~99.85%
- **2019**: ~99.75%
- **2020**: ~99.70%
- **2021**: ~99.85%
- **2022**: ~99.90%
- **2023**: ~99.75%
- **2024**: ~99.95% (note: x-axis ends at 2023, but data extends to 2024)
- **Trends**:
- The line exhibits a **general upward trend** from 2018 to 2023, with a peak of ~99.90% in 2022.
- Notable dips occur in **2019** (~99.75%), **2020** (~99.70%), and **2023** (~99.75%).
- The final data point (2024) suggests a rebound to ~99.95%, though this falls outside the x-axis range.
---
### Key Observations
1. **Fluctuations**: The proportion of successful rebuilds varies year-to-year, with no consistent pattern of growth or decline.
2. **Peaks and Troughs**:
- Highest value: ~99.90% in 2022.
- Lowest value: ~99.70% in 2020.
3. **Final Data Point**: The 2024 value (~99.95%) exceeds the x-axis range, indicating potential data inconsistency or a typo.
---
### Interpretation
The graph suggests that the proportion of successful rebuilds has **improved overall** from 2018 to 2023, with a notable increase in 2022. However, the dips in 2019, 2020, and 2023 may reflect external factors (e.g., operational challenges, resource constraints) or measurement variability. The 2024 data point, while higher than previous years, conflicts with the x-axis range, raising questions about data accuracy or scope.
The upward trend implies that rebuild processes may have become more efficient or reliable over time, but the fluctuations highlight the need for further investigation into the causes of periodic declines.