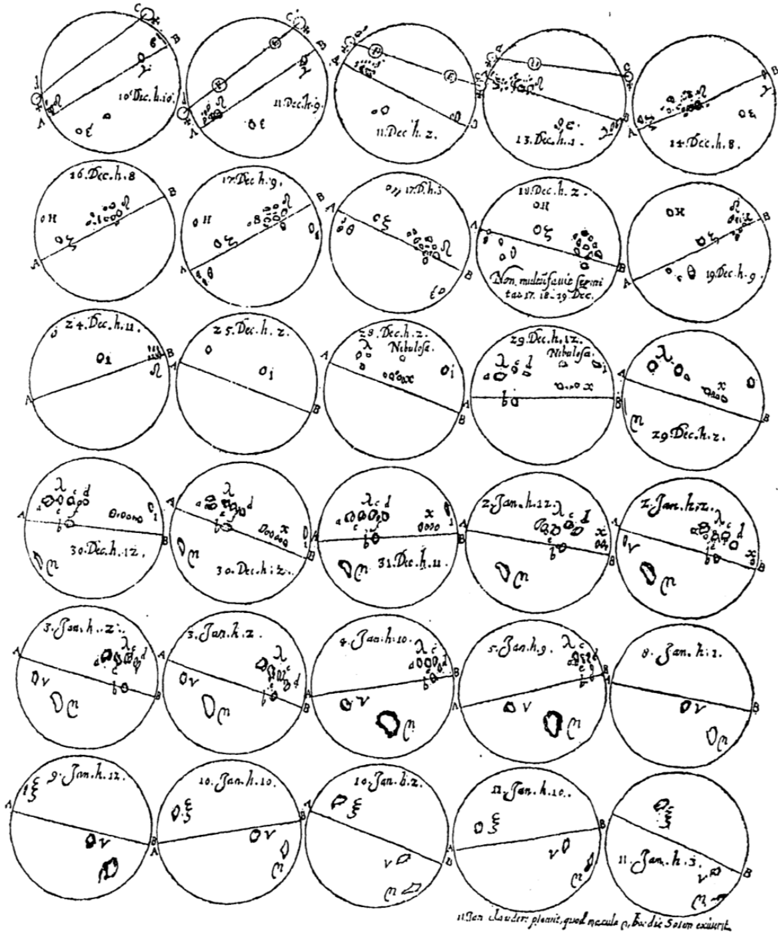
## Chart/Diagram Type: Astronomical Observation Log
### Overview
The image depicts a 5x5 grid of 25 hand-drawn circles, each containing a horizontal line and textual annotations. The circles are labeled with dates spanning December 16 to January 11, suggesting a chronological record. Each circle includes numerical values (e.g., 0.3, 0.5), letters (e.g., O, V, C), and occasional words (e.g., "Nebulosa," "muscleinfaucie ferini"). A Latin note at the bottom references "planet, quod macula, &c." ("planet, which is a spot, &c."), implying the circles document planetary observations.
### Components/Axes
- **Dates**: Labeled in the top-left corner of each circle (e.g., "16 Dec. h. 8," "17 Dec. h. 9").
- **Horizontal Line**: Divides each circle into upper and lower halves, possibly representing observational phases or positional data.
- **Textual Annotations**:
- Numerical values (e.g., 0.3, 0.5, 0.1, 0.2) likely denote measurements (e.g., size, brightness, or positional coordinates).
- Letters (e.g., O, V, C, B) may represent observational instruments, features, or categories.
- Words like "Nebulosa" (nebula) and "muscleinfaucie ferini" (possibly a misspelling of "muscleinfaucie ferini," a term not found in standard astronomy) suggest annotations about observed phenomena.
- **Latin Note**: "niger clauder planet, quod macula, &c. Bovic 5000 excurrit" ("black cloud planet, which is a spot, &c. Bovic 5000 excurrit"), possibly a title or summary.
### Detailed Analysis
#### Date-Specific Observations
1. **December 16–19**:
- Circles include values like 0.3, 0.5, and letters O, V, B.
- Example: "16 Dec. h. 8" has "0.3" and "0.5" with O and V.
- "18 Dec. h. 9" includes "muscleinfaucie ferini" and "0.5."
2. **December 20–31**:
- Values shift to 0.1, 0.2, and letters O, C, B.
- Example: "20 Dec. h. 11" has "0.1" and "0.2" with O and C.
- "30 Dec. h. 12" includes "0.1" and "0.2" with O and C.
3. **January 3–11**:
- Values like 0.3, 0.5, and letters O, V, C persist.
- Example: "3 Jan. h. 12" has "0.3" and "0.5" with O and V.
- "10 Jan. h. 10" includes "0.3" and "0.5" with O and V.
#### Key Textual Elements
- **Nebulosa**: Appears in multiple circles (e.g., "20 Dec. h. 11"), suggesting observations of nebulae.
- **Muscleinfaucie ferini**: A unique term, possibly a misspelling or archaic term for a specific feature.
- **Latin Note**: "niger clauder planet, quod macula, &c." implies a focus on planetary spots or clouds.
### Key Observations
1. **Temporal Pattern**: Observations span 26 days, with consistent annotations across dates.
2. **Numerical Trends**: Values like 0.3 and 0.5 recur, potentially indicating repeated measurements.
3. **Letter Codes**: O, V, C, B may denote observational tools (e.g., telescopes) or features (e.g., "O" for "object").
4. **Anomalies**: The term "muscleinfaucie ferini" stands out as unclear, requiring further context.
### Interpretation
The diagram likely documents systematic astronomical observations, tracking planetary features (e.g., spots, nebulas) over time. The horizontal lines may represent positional data (e.g., latitude/longitude) or observational phases. Numerical values could quantify brightness, size, or distance, while letters might categorize observations (e.g., "O" for "object," "V" for "variable"). The Latin note suggests a focus on planetary phenomena, possibly from a historical or archaic source.
The recurring "0.3" and "0.5" values may indicate a baseline measurement, while variations (e.g., 0.1, 0.2) could reflect changes in observed features. The term "Nebulosa" aligns with 19th-century astronomical terminology, supporting the hypothesis of a historical log.
### Conclusion
This image represents a meticulous record of planetary observations, blending numerical data, categorical labels, and descriptive annotations. The Latin note and archaic terms suggest a historical context, possibly from a 19th-century astronomer documenting celestial events. Further analysis would require cross-referencing with historical records to validate the terminology and measurements.