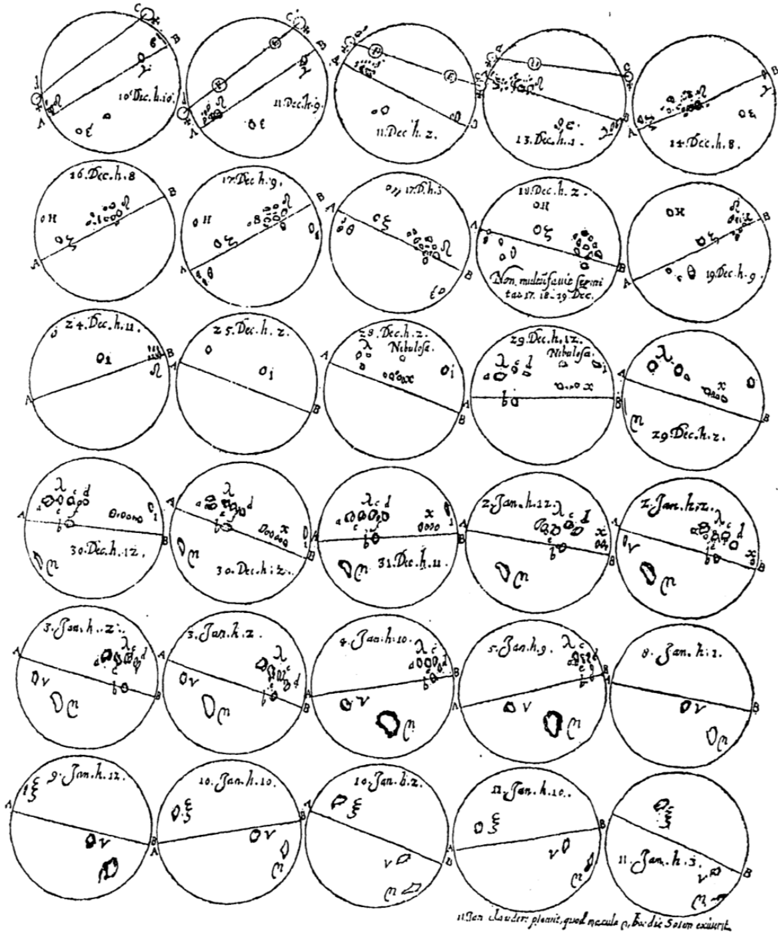
## Series of Astronomical Observations
### Overview
The image presents a series of 30 circular diagrams arranged in a grid, each representing an astronomical observation made between December 10th and January 11th. Each circle contains markings indicating the positions of celestial bodies or phenomena, with a line segment labeled 'A' and 'B' across each circle. The diagrams are annotated with dates and times.
### Components/Axes
* **Circular Diagrams:** Each circle represents a field of view of the sky.
* **Line Segment AB:** A line segment is drawn across each circle, labeled 'A' at one end and 'B' at the other. This line likely represents a reference line or axis within the field of view.
* **Celestial Markings:** Various dots, circles, and symbols within each circle represent observed celestial objects or phenomena.
* **Date and Time Labels:** Each diagram is labeled with a date and time, indicating when the observation was made. The dates range from "10. Dec." to "11. Jan."
* **Additional Text:** Some diagrams contain additional text, such as "Nibulosa" or numerical values.
### Detailed Analysis or ### Content Details
The diagrams are arranged in a grid of 6 rows and 5 columns. Each diagram is analyzed individually:
* **Row 1:**
* **Diagram 1 (10. Dec. h.10):** Contains several dots and circles, with a line segment connecting points near the top of the circle.
* **Diagram 2 (11. Dec. h.9):** Similar to the first, with dots and circles.
* **Diagram 3 (11. Dec. h.2):** Contains dots and circles.
* **Diagram 4 (13. Dec. h.5):** Contains dots and circles.
* **Diagram 5 (14. Dec. h.8):** Contains dots and circles.
* **Row 2:**
* **Diagram 6 (16. Dec. h.8):** Contains numerous small dots.
* **Diagram 7 (17. Dec. h.9):** Contains numerous small dots.
* **Diagram 8 (17. Dec. h.5):** Contains dots and circles.
* **Diagram 9 (18. Dec. h.2):** Contains dots and circles.
* **Diagram 10 (19. Dec. h.9):** Contains dots and circles.
* **Row 3:**
* **Diagram 11 (24. Dec. h.11):** Contains a symbol resembling an omega (Ω).
* **Diagram 12 (25. Dec. h.2):** Contains a symbol resembling an omega (Ω).
* **Diagram 13 (28. Dec. h.2. Nibulosa):** Contains dots and the word "Nibulosa".
* **Diagram 14 (29. Dec. h.2. Nibulosa):** Contains dots and the word "Nibulosa".
* **Diagram 15 (29. Dec. h.2):** Contains dots and circles.
* **Row 4:**
* **Diagram 16 (30. Dec. h.12):** Contains dots and numerical annotations.
* **Diagram 17 (30. Dec. h.2):** Contains dots and numerical annotations.
* **Diagram 18 (31. Dec. h.11):** Contains dots and numerical annotations.
* **Diagram 19 (1. Jan. h.12):** Contains dots and circles.
* **Diagram 20 (1. Jan. h.2):** Contains dots and circles.
* **Row 5:**
* **Diagram 21 (3. Jan. h.2):** Contains dots and circles.
* **Diagram 22 (3. Jan. h.2):** Contains dots and circles.
* **Diagram 23 (4. Jan. h.10):** Contains dots and circles.
* **Diagram 24 (5. Jan. h.9):** Contains dots and circles.
* **Diagram 25 (8. Jan. h.2):** Contains dots and circles.
* **Row 6:**
* **Diagram 26 (9. Jan. h.12):** Contains dots and circles.
* **Diagram 27 (10. Jan. h.10):** Contains dots and circles.
* **Diagram 28 (10. Jan. h.2):** Contains dots and circles.
* **Diagram 29 (11. Jan. h.10):** Contains dots and circles.
* **Diagram 30 (11. Jan. h.3):** Contains dots and circles.
Additional Text:
* In the middle of the second row, between the 8th and 9th diagram, there is text: "Nom. multifarie fermi tas 17. 18-19 Dec."
* At the bottom of the image: "11. Ter claudere planit, quod neculen, bu die Sotem exiurit."
### Key Observations
* The diagrams show a progression of observations over time.
* The density and arrangement of dots and circles vary between diagrams, suggesting changes in the observed celestial phenomena.
* The presence of the word "Nibulosa" in some diagrams indicates the observation of nebulae.
* The line segment AB provides a consistent reference point across all observations.
### Interpretation
The image represents a series of astronomical observations, likely of the night sky. The diagrams document the positions and characteristics of celestial objects, possibly including stars, planets, and nebulae, over a period of approximately one month. The line segment AB likely serves as a reference line for measuring the positions of these objects. The annotations provide the dates and times of the observations, allowing for the tracking of changes in the observed phenomena over time. The text at the bottom is Latin and translates to "Three times he closed the plain, which on this day he drew out of the Sun." This suggests the observations are related to the movement or appearance of something near the sun.