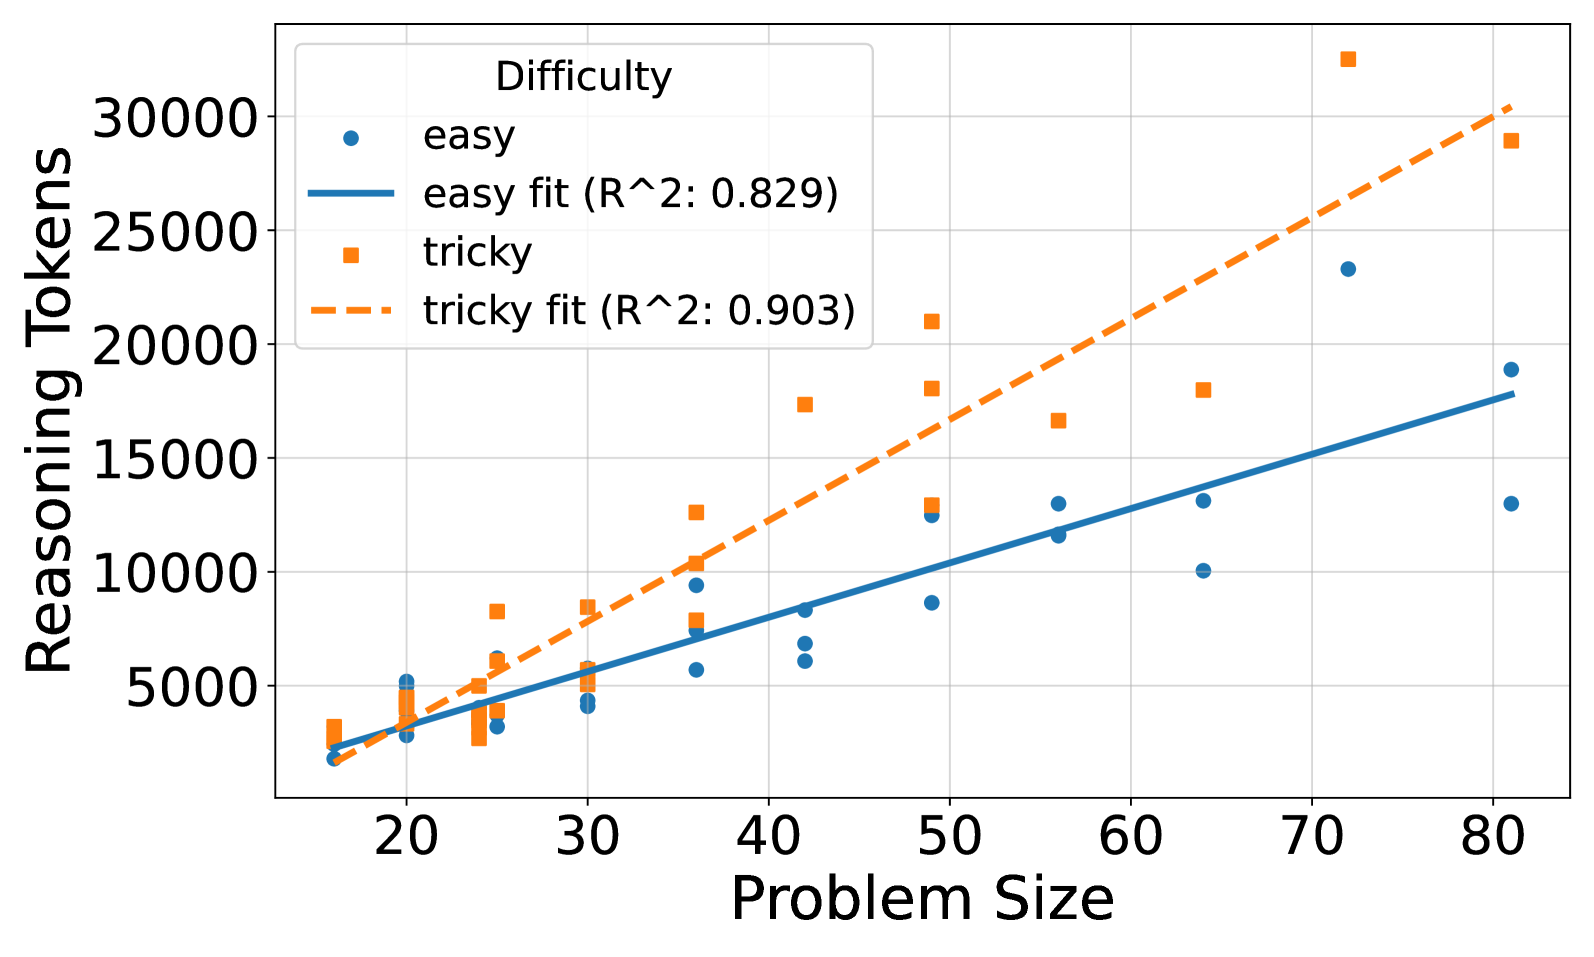
## Scatter Plot: Reasoning Tokens vs. Problem Size by Difficulty
### Overview
This image presents a scatter plot illustrating the relationship between Problem Size (x-axis) and Reasoning Tokens (y-axis) for two levels of Difficulty: "easy" and "tricky". Linear regression fits are overlaid on each data set, with R-squared values provided. The plot aims to demonstrate how the computational effort (Reasoning Tokens) scales with the size of the problem, and whether this scaling differs based on the problem's difficulty.
### Components/Axes
* **X-axis:** Problem Size (ranging approximately from 18 to 82).
* **Y-axis:** Reasoning Tokens (ranging approximately from 2000 to 32000).
* **Legend:** Located in the top-left corner.
* "easy" - Represented by blue circles.
* "easy fit (R^2: 0.829)" - Represented by a solid blue line.
* "tricky" - Represented by orange squares.
* "tricky fit (R^2: 0.903)" - Represented by a dashed orange line.
* **Gridlines:** Present for both axes, aiding in value estimation.
### Detailed Analysis
**Easy Data (Blue):**
The "easy" data points (blue circles) generally show an upward trend, indicating that as Problem Size increases, so do Reasoning Tokens. The data is somewhat scattered, but a linear fit is provided.
* At Problem Size ≈ 20, Reasoning Tokens ≈ 3000.
* At Problem Size ≈ 30, Reasoning Tokens ≈ 4500.
* At Problem Size ≈ 40, Reasoning Tokens ≈ 7000.
* At Problem Size ≈ 50, Reasoning Tokens ≈ 9500.
* At Problem Size ≈ 60, Reasoning Tokens ≈ 11000.
* At Problem Size ≈ 70, Reasoning Tokens ≈ 15000.
* At Problem Size ≈ 80, Reasoning Tokens ≈ 18000.
The linear fit (solid blue line) starts at approximately Reasoning Tokens ≈ 2000 at Problem Size ≈ 18 and ends at approximately Reasoning Tokens ≈ 20000 at Problem Size ≈ 82.
**Tricky Data (Orange):**
The "tricky" data points (orange squares) also exhibit an upward trend, but are generally positioned *above* the "easy" data points, suggesting that "tricky" problems require more Reasoning Tokens for the same Problem Size. The data is also scattered, but the linear fit appears to be a better fit than the "easy" data.
* At Problem Size ≈ 20, Reasoning Tokens ≈ 3500.
* At Problem Size ≈ 30, Reasoning Tokens ≈ 6000.
* At Problem Size ≈ 40, Reasoning Tokens ≈ 9000.
* At Problem Size ≈ 50, Reasoning Tokens ≈ 20000.
* At Problem Size ≈ 60, Reasoning Tokens ≈ 16000.
* At Problem Size ≈ 70, Reasoning Tokens ≈ 31000.
* At Problem Size ≈ 80, Reasoning Tokens ≈ 28000.
The linear fit (dashed orange line) starts at approximately Reasoning Tokens ≈ 2500 at Problem Size ≈ 18 and ends at approximately Reasoning Tokens ≈ 31000 at Problem Size ≈ 82.
### Key Observations
* The R-squared value for the "tricky" fit (0.903) is higher than that for the "easy" fit (0.829), indicating that the linear model explains a larger proportion of the variance in the "tricky" data.
* For a given Problem Size, "tricky" problems consistently require more Reasoning Tokens than "easy" problems.
* The "tricky" data at Problem Size ≈ 50 and 70 appears to be outliers, with significantly higher Reasoning Token values than the surrounding points.
* The "tricky" data at Problem Size ≈ 80 appears to be an outlier, with a significantly lower Reasoning Token value than the surrounding points.
### Interpretation
The data suggests a positive correlation between Problem Size and Reasoning Tokens for both "easy" and "tricky" problems. This indicates that the computational cost of solving these problems increases as the problem becomes larger. The higher Reasoning Token requirements for "tricky" problems suggest that they are more complex and require more computational effort to solve.
The higher R-squared value for the "tricky" data suggests that the relationship between Problem Size and Reasoning Tokens is more linear for "tricky" problems than for "easy" problems. This could be due to the fact that "tricky" problems have a more consistent structure or require a more predictable set of operations to solve.
The outliers in the "tricky" data may represent problems that are particularly difficult or require a different approach to solve. Further investigation would be needed to understand the reasons for these outliers. The data suggests that the scaling of Reasoning Tokens with Problem Size is not perfectly linear, and that there may be other factors that influence the computational cost of solving these problems.