## Scatter Plot: Relationship Between Problem Size and Reasoning Tokens
### Overview
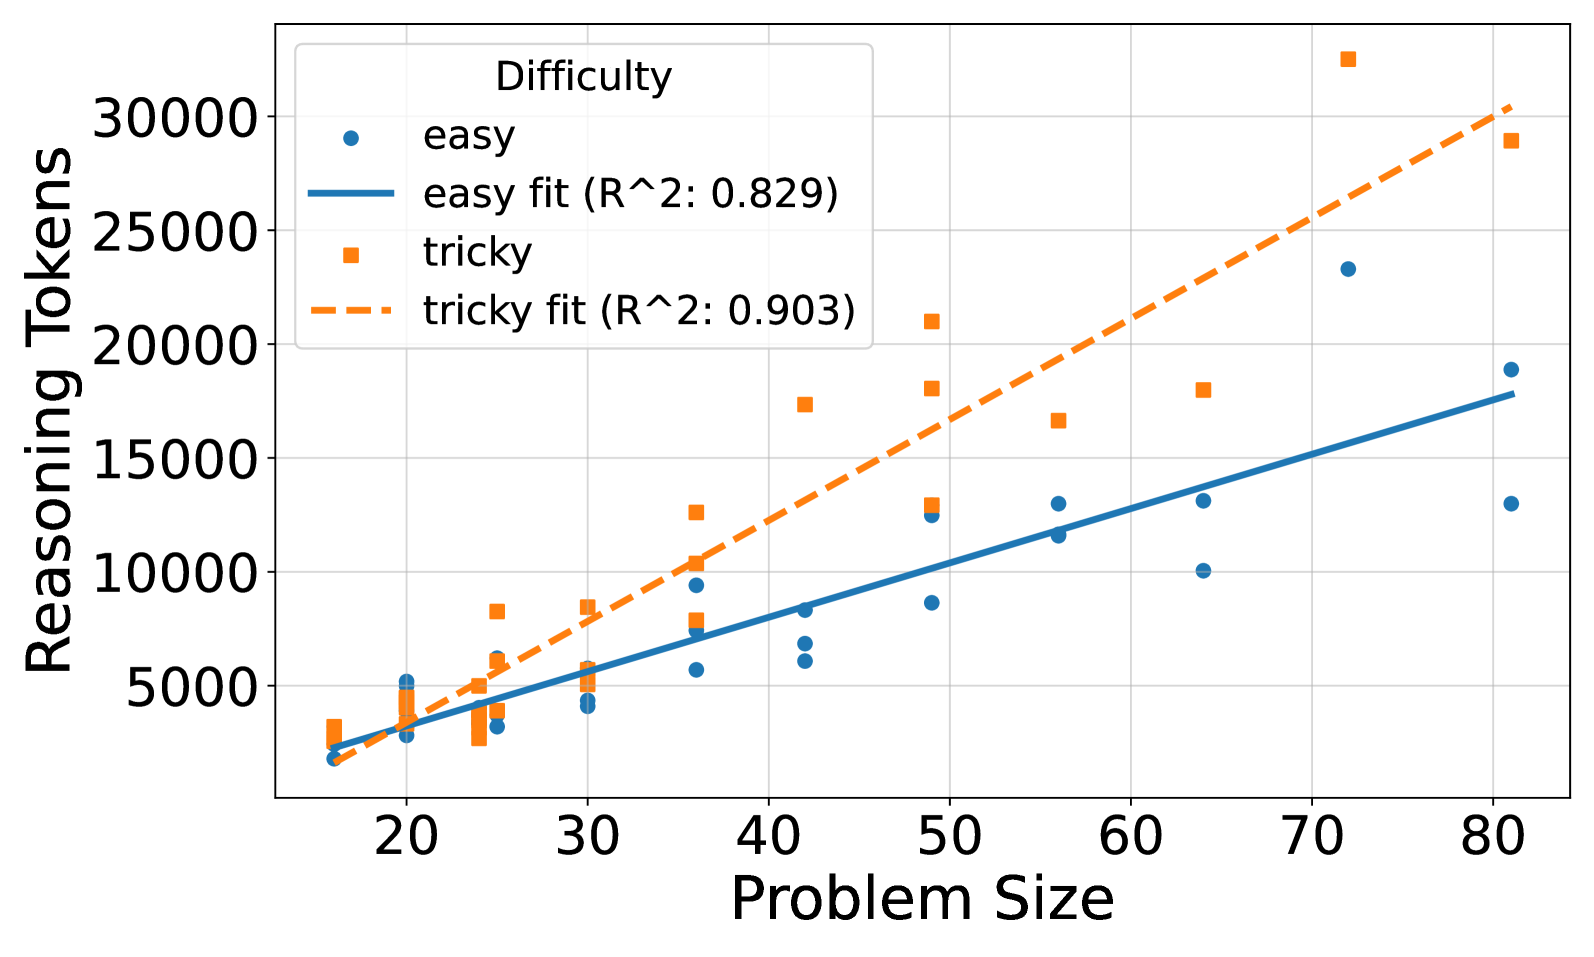
The image is a scatter plot comparing the relationship between problem size (x-axis) and reasoning tokens (y-axis) for two difficulty levels: "easy" and "tricky." Two trend lines are overlaid: a solid blue line for "easy" problems (R² = 0.829) and a dashed orange line for "tricky" problems (R² = 0.903). Data points are represented as blue dots (easy) and orange squares (tricky).
### Components/Axes
- **X-axis (Problem Size)**: Ranges from 20 to 80 in increments of 10.
- **Y-axis (Reasoning Tokens)**: Ranges from 0 to 30,000 in increments of 5,000.
- **Legend**: Located in the top-left corner, with:
- Blue dots labeled "easy" (solid line, R² = 0.829).
- Orange squares labeled "tricky" (dashed line, R² = 0.903).
### Detailed Analysis
1. **Trend Lines**:
- **Easy (Blue)**: The solid blue line slopes upward, indicating a positive correlation between problem size and reasoning tokens. R² = 0.829 suggests a strong linear relationship.
- **Tricky (Orange)**: The dashed orange line also slopes upward but is steeper than the blue line, with a higher R² (0.903), indicating a stronger linear fit for tricky problems.
2. **Data Points**:
- **Easy (Blue Dots)**: Scattered around the blue line, with values ranging from ~2,000 to ~20,000 tokens as problem size increases from 20 to 80.
- **Tricky (Orange Squares)**: Positioned higher than easy data points, with values ranging from ~4,000 to ~30,000 tokens. The orange squares align closely with the dashed line, especially at larger problem sizes.
3. **Spatial Grounding**:
- Legend: Top-left corner.
- Blue line: Bottom-left to top-right, slightly below the orange line.
- Orange line: Bottom-left to top-right, steeper and higher than the blue line.
### Key Observations
- Both difficulty levels show increasing reasoning tokens with larger problem sizes.
- Tricky problems consistently require more tokens than easy problems at equivalent problem sizes.
- The orange line (tricky) has a higher R², suggesting better predictability for tricky problems.
- Data points for tricky problems are more tightly clustered around their trend line compared to easy problems.
### Interpretation
The data demonstrates that problem size directly influences the number of reasoning tokens required, with tricky problems demanding significantly more resources. The higher R² for tricky problems (0.903 vs. 0.829) implies that the model’s predictions for tricky problems are more reliable, possibly due to clearer patterns in their complexity. The steeper slope for tricky problems suggests that their difficulty scales more rapidly with problem size. Outliers are minimal, but the spread in easy problem data points may reflect variability in problem-solving strategies or external factors affecting token usage.