\n
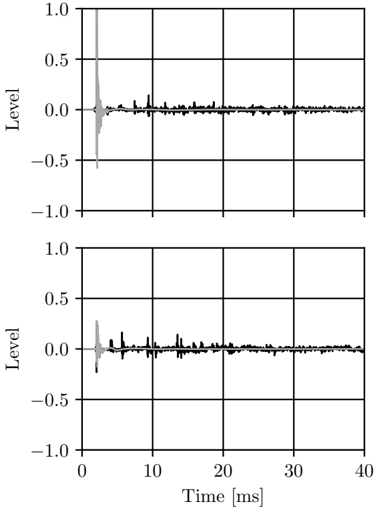
## Chart: Signal Level vs. Time
### Overview
The image presents two identical line charts displaying signal level as a function of time. Both charts show a rapid initial drop in signal level followed by a stabilization around zero, with some minor fluctuations. The charts appear to represent the same data, potentially showing replicates or different conditions.
### Components/Axes
* **X-axis:** Time [ms], ranging from 0 to 40 milliseconds. The axis is marked with increments of 10 ms.
* **Y-axis:** Level, ranging from -1.0 to 1.0. The axis is marked with increments of 0.5.
* **Data Series:** A single black line is present in each chart, representing the signal level over time.
* **Gridlines:** A grid is overlaid on both charts, aiding in the reading of values.
### Detailed Analysis
Both charts exhibit similar behavior.
**Chart 1:**
* The signal level starts at approximately 0.2 at time 0 ms.
* There is a rapid decrease in signal level, reaching a minimum of approximately -0.75 at around 1.5 ms.
* Following the initial drop, the signal level oscillates around 0, with fluctuations between approximately -0.2 and 0.2.
* From approximately 5 ms to 40 ms, the signal level remains relatively stable, fluctuating within a narrow range around 0.
**Chart 2:**
* The signal level starts at approximately 0.15 at time 0 ms.
* There is a rapid decrease in signal level, reaching a minimum of approximately -0.7 at around 1.5 ms.
* Following the initial drop, the signal level oscillates around 0, with fluctuations between approximately -0.2 and 0.2.
* From approximately 5 ms to 40 ms, the signal level remains relatively stable, fluctuating within a narrow range around 0.
### Key Observations
* Both charts show a very similar initial drop in signal level.
* The signal stabilizes around zero after the initial transient.
* The fluctuations after the initial drop are relatively small in amplitude.
* There is a slight difference in the initial signal level between the two charts.
### Interpretation
The charts likely represent a signal response to a step input or a similar triggering event. The initial drop suggests a rapid change in signal state, followed by a settling period where the signal fluctuates around a baseline level of zero. The similarity between the two charts suggests the system is behaving consistently. The slight difference in initial signal level could be due to minor variations in experimental conditions or measurement noise. The data suggests a fast response time (less than 5 ms) and a stable baseline after the initial transient. The charts do not provide information about the nature of the signal or the system generating it, only its temporal behavior.