## ScatterPlot: Win Rate vs. Test-time Tokens
### Overview
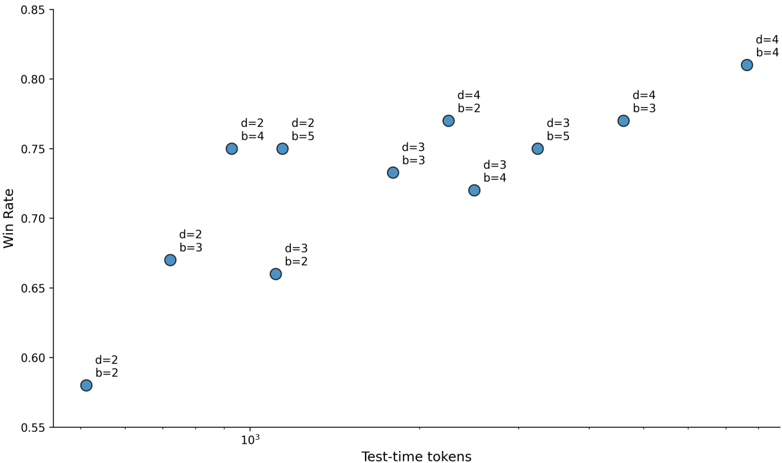
The image is a scatter plot visualizing the relationship between **Test-time tokens** (x-axis, logarithmic scale) and **Win Rate** (y-axis, linear scale). Data points are labeled with combinations of parameters `d` (depth) and `b` (breadth), with all points colored blue. The legend is positioned on the right side of the plot.
---
### Components/Axes
- **X-axis (Test-time tokens)**: Logarithmic scale ranging from $10^3$ to $10^4$. Tick marks are labeled at $10^3$, $10^{3.5}$, and $10^4$.
- **Y-axis (Win Rate)**: Linear scale from 0.55 to 0.85, with increments of 0.05.
- **Legend**: Located on the right, associating blue color with all data points (no distinct subcategories).
- **Data Points**: Labeled with `d` (depth) and `b` (breadth) values, e.g., `d=2, b=2`, `d=4, b=4`.
---
### Detailed Analysis
- **Data Points**:
- `d=2, b=2`: (10³, 0.58)
- `d=2, b=3`: (10³.⁵, 0.67)
- `d=2, b=4`: (10³.⁵, 0.75)
- `d=2, b=5`: (10³.⁵, 0.75)
- `d=3, b=2`: (10³.⁵, 0.66)
- `d=3, b=3`: (10³.⁵, 0.73)
- `d=3, b=4`: (10³.⁵, 0.72)
- `d=3, b=5`: (10³.⁵, 0.75)
- `d=4, b=2`: (10³.⁵, 0.77)
- `d=4, b=3`: (10³.⁵, 0.76)
- `d=4, b=4`: (10⁴, 0.81)
- **Trends**:
- **General Trend**: Win Rate increases with higher Test-time tokens (e.g., from 0.58 at $10^3$ to 0.81 at $10^4$).
- **Parameter Effects**:
- Higher `d` (depth) and `b` (breadth) values generally correlate with higher Win Rates (e.g., `d=4, b=4` at $10^4$ achieves 0.81).
- At the same Test-time token value, combinations with higher `d` and `b` (e.g., `d=4, b=4`) outperform lower combinations (e.g., `d=2, b=3` at $10^{3.5}$ with 0.67).
---
### Key Observations
1. **Outliers**:
- `d=2, b=3` at $10^{3.5}$ (0.67) and `d=3, b=2` at $10^{3.5}$ (0.66) show lower Win Rates compared to other combinations at the same token count.
- `d=4, b=4` at $10^4$ (0.81) is the highest Win Rate observed.
2. **Parameter Interactions**:
- Increasing `d` and `b` together improves performance, but the effect is non-linear. For example, `d=3, b=5` (0.75) at $10^{3.5}$ performs better than `d=2, b=5` (0.75) at the same token count.
3. **Logarithmic Scale**:
- The x-axis’s logarithmic scale emphasizes performance differences at lower token ranges (e.g., $10^3$ vs. $10^{3.5}$).
---
### Interpretation
The data suggests that **Test-time tokens** and the interplay between **depth (`d`)** and **breadth (`b`)** are critical factors in determining Win Rate. While higher token counts generally improve performance, the optimal combination of `d` and `b` depends on the scale of tokens. For instance:
- At lower token ranges ($10^3$–$10^{3.5}$), smaller `d` and `b` values (e.g., `d=2, b=2`) underperform compared to larger ones.
- At higher token ranges ($10^4$), larger `d` and `b` (e.g., `d=4, b=4`) achieve the highest Win Rates, indicating scalability benefits.
The outliers highlight that **parameter tuning** is essential: even with more tokens, suboptimal `d` and `b` combinations can limit performance. This underscores the need for adaptive strategies that balance token count with parameter selection.