## Flow Diagram: LLM Integration with Multiple Agents
### Overview
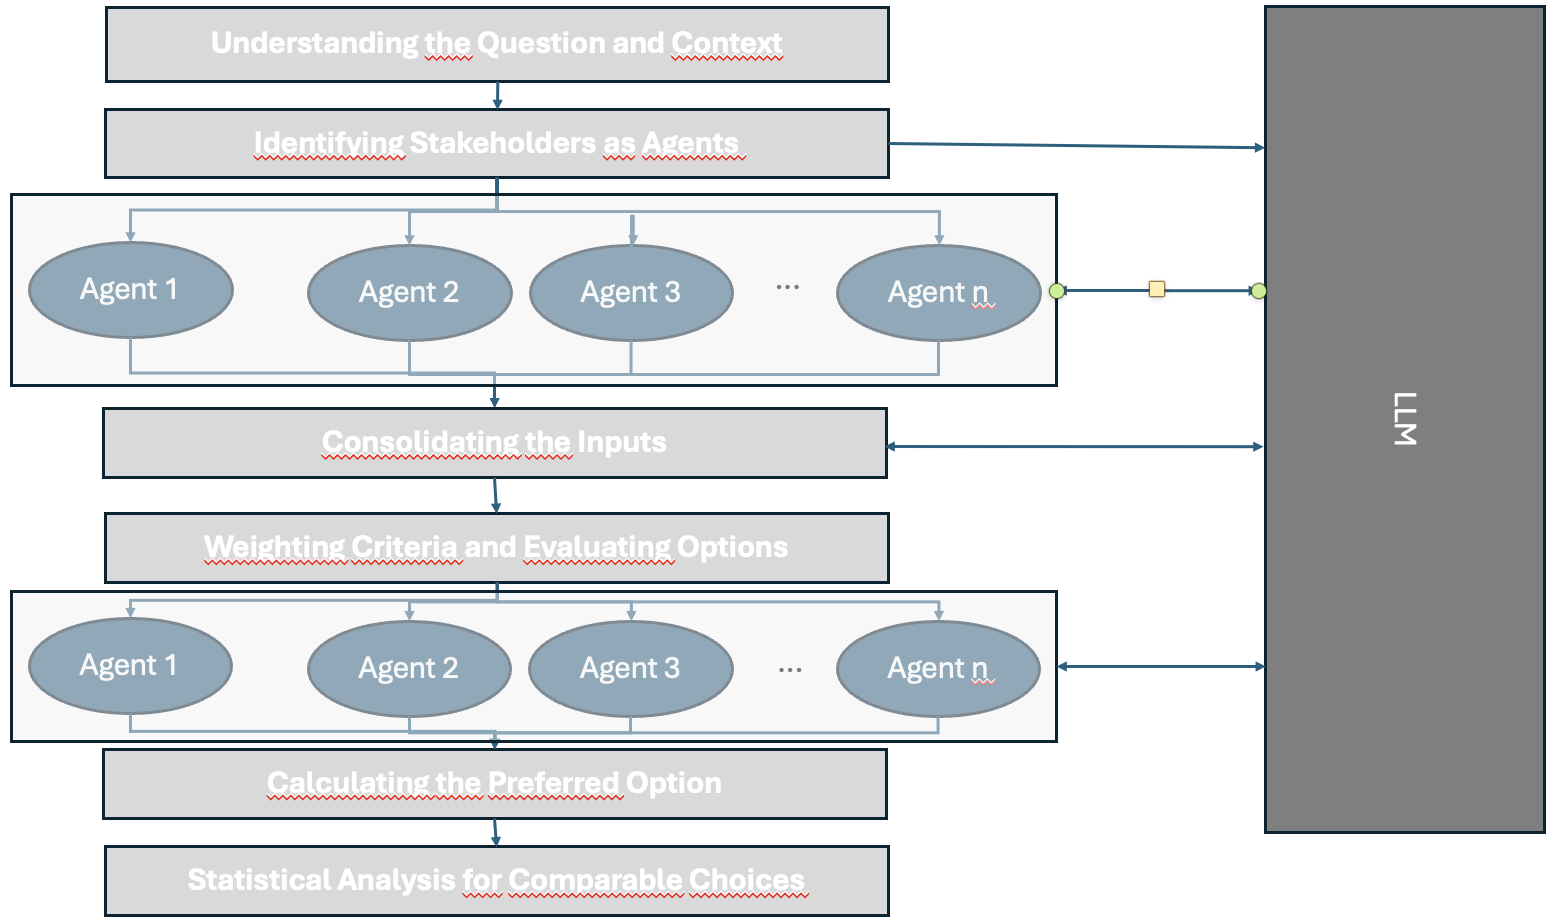
The image is a flow diagram illustrating how a Large Language Model (LLM) interacts with multiple agents to process information and make decisions. The diagram outlines a series of steps, from understanding the initial question to performing statistical analysis, with agents providing input at various stages.
### Components/Axes
The diagram consists of the following components:
1. **Understanding the Question and Context:** A gray rectangular box at the top of the diagram.
2. **Identifying Stakeholders as Agents:** A gray rectangular box below the first one.
3. **Agent Input (Top):** A box containing multiple oval shapes labeled "Agent 1", "Agent 2", "Agent 3", and "Agent n". Arrows connect these agents, indicating potential interaction or feedback loops.
4. **Consolidating the Inputs:** A gray rectangular box below the agent input stage.
5. **Weighting Criteria and Evaluating Options:** A gray rectangular box below the consolidation stage.
6. **Agent Input (Bottom):** Another box containing oval shapes labeled "Agent 1", "Agent 2", "Agent 3", and "Agent n". Arrows connect these agents, indicating potential interaction or feedback loops.
7. **Calculating the Preferred Option:** A gray rectangular box below the second agent input stage.
8. **Statistical Analysis for Comparable Choices:** A gray rectangular box at the bottom of the diagram.
9. **LLM:** A large gray rectangular box on the right side of the diagram, representing the Large Language Model.
10. **Arrows:** Arrows indicate the flow of information between the different stages and the LLM.
### Detailed Analysis or ### Content Details
* **Understanding the Question and Context:** The process begins with understanding the initial question and its context.
* **Identifying Stakeholders as Agents:** Stakeholders are identified and treated as agents.
* **Agent Input (Top):** Agents provide input, potentially interacting with each other. Arrows connect each agent to each other.
* **Consolidating the Inputs:** The inputs from the agents are consolidated.
* **Weighting Criteria and Evaluating Options:** Criteria are weighted, and options are evaluated.
* **Agent Input (Bottom):** Agents provide input again, potentially interacting with each other. Arrows connect each agent to each other.
* **Calculating the Preferred Option:** The preferred option is calculated based on the inputs and evaluation.
* **Statistical Analysis for Comparable Choices:** Statistical analysis is performed on comparable choices.
* **LLM:** The LLM receives input from multiple stages:
* "Identifying Stakeholders as Agents"
* The output of the first set of agents ("Agent 1" to "Agent n")
* "Consolidating the Inputs"
* The output of the second set of agents ("Agent 1" to "Agent n")
* "Calculating the Preferred Option"
### Key Observations
* The diagram illustrates a multi-stage decision-making process.
* Agents provide input at two distinct stages.
* The LLM receives input from multiple stages, suggesting it plays a central role in the process.
* There are feedback loops between agents in both agent input stages.
### Interpretation
The diagram depicts a system where an LLM is integrated into a decision-making process involving multiple agents. The agents provide input at different stages, allowing for iterative refinement and evaluation of options. The LLM likely uses these inputs to generate insights, evaluate options, and ultimately assist in calculating the preferred option. The statistical analysis stage suggests that the system is designed to handle comparable choices and potentially learn from past decisions. The feedback loops between agents indicate a collaborative or competitive dynamic where agents can influence each other's inputs.