\n
## Diagram: Decision-Making Process with Stakeholder Input
### Overview
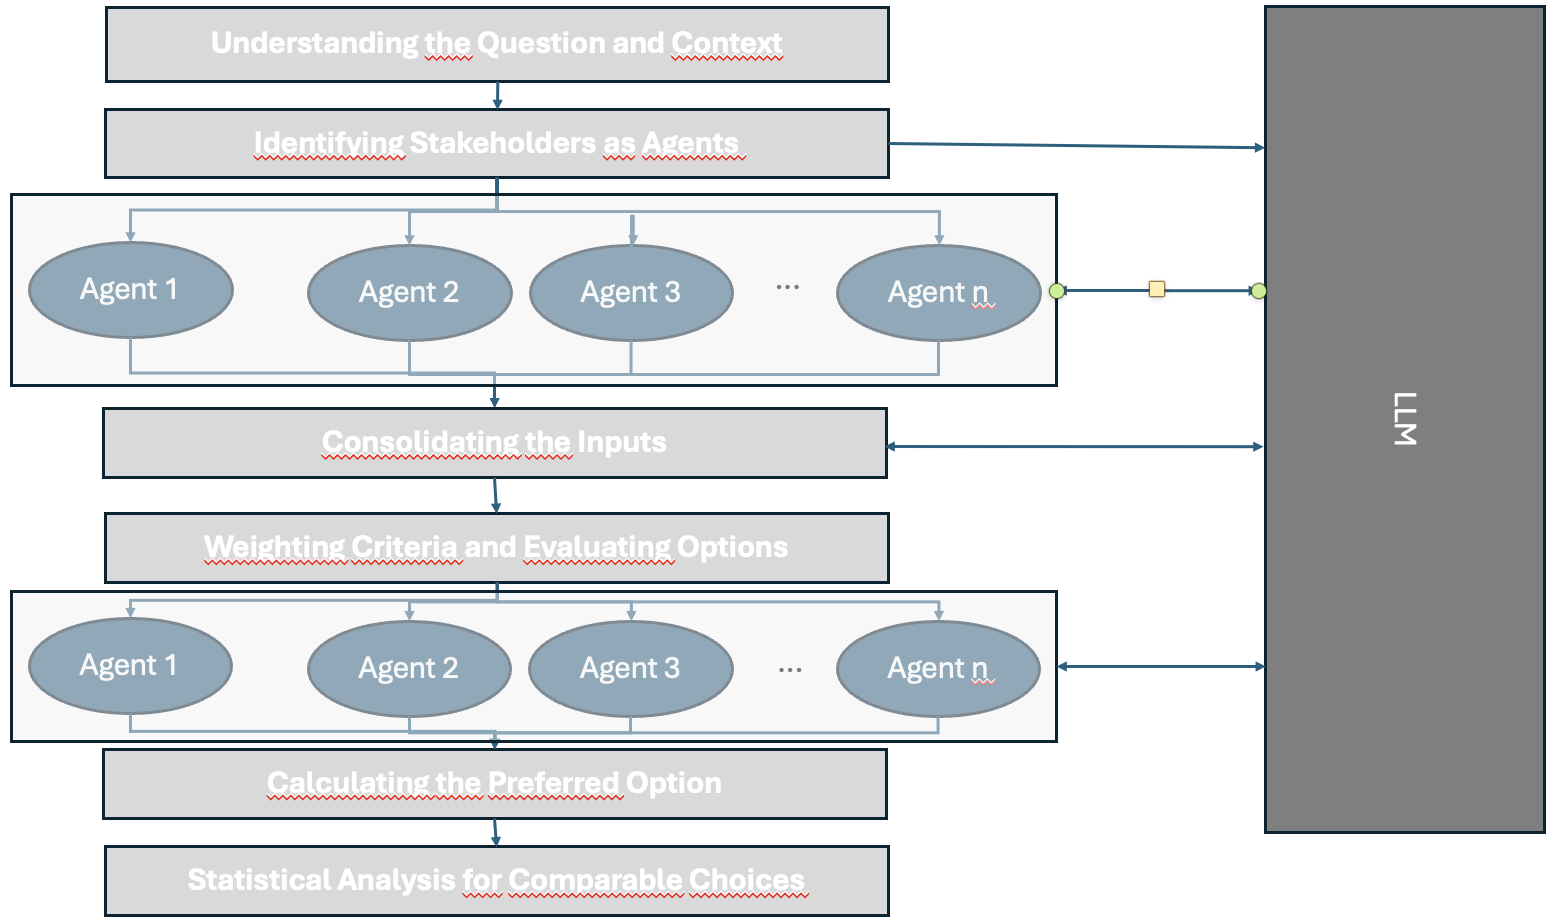
The image depicts a flowchart illustrating a decision-making process that incorporates input from multiple stakeholders ("Agents"). The process begins with understanding the question and context, proceeds through stakeholder identification and input consolidation, then moves to weighting criteria, evaluating options, calculating the preferred option, and finally, statistical analysis. The diagram emphasizes a cyclical flow of information, with feedback loops between stages.
### Components/Axes
The diagram consists of rectangular boxes representing process steps, oval shapes representing stakeholders ("Agents"), and arrows indicating the flow of information. Text labels within the boxes and arrows describe the actions performed at each stage. The diagram is divided into two main sections, visually separated by a vertical line labeled "LLM" on the right side.
* **Process Steps (Rectangles):**
* "Understanding the Question and Context"
* "Consolidating the Inputs"
* "Calculating the Preferred Option"
* "Statistical Analysis for Comparable Choices"
* **Stakeholder Input Stages (Rectangles):**
* "Identifying Stakeholders as Agents"
* "Weighting Criteria and Evaluating Options"
* **Stakeholders (Ovals):**
* "Agent 1"
* "Agent 2"
* "Agent 3"
* "...Agent n"
* **Arrows:** Indicate the flow of information and feedback loops. Arrows are labeled with descriptive text.
### Detailed Analysis or Content Details
The diagram illustrates a two-stage stakeholder input process.
**Stage 1: Initial Stakeholder Identification & Input**
1. The process begins with "Understanding the Question and Context".
2. This leads to "Identifying Stakeholders as Agents". An arrow points from this step to a series of oval shapes labeled "Agent 1", "Agent 2", "Agent 3", and "...Agent n".
3. An arrow flows from each "Agent" oval to a box labeled "Consolidating the Inputs".
4. A feedback loop exists from "Consolidating the Inputs" back to "Identifying Stakeholders as Agents", indicated by a curved arrow.
**Stage 2: Evaluation & Calculation**
1. "Consolidating the Inputs" leads to "Weighting Criteria and Evaluating Options".
2. Similar to the first stage, an arrow points from this step to a series of oval shapes labeled "Agent 1", "Agent 2", "Agent 3", and "...Agent n".
3. An arrow flows from each "Agent" oval to a box labeled "Calculating the Preferred Option".
4. A feedback loop exists from "Calculating the Preferred Option" back to "Weighting Criteria and Evaluating Options", indicated by a curved arrow.
5. Finally, "Calculating the Preferred Option" leads to "Statistical Analysis for Comparable Choices".
The "LLM" label on the right side suggests that a Large Language Model is involved in some aspect of the process, potentially in consolidating inputs or performing the statistical analysis. The diagram does not specify *how* the LLM is involved.
### Key Observations
* The diagram emphasizes iterative refinement. The feedback loops suggest that stakeholder input is continuously incorporated and re-evaluated.
* The process is designed to be inclusive, involving multiple stakeholders ("Agents").
* The LLM is positioned as a component that supports the final stages of the decision-making process.
* The diagram is conceptual and does not provide specific data or numerical values.
### Interpretation
This diagram represents a structured approach to decision-making that prioritizes stakeholder engagement and data-driven analysis. The inclusion of an LLM suggests a modern approach that leverages artificial intelligence to enhance the process. The iterative nature of the process, indicated by the feedback loops, highlights the importance of continuous improvement and adaptation. The diagram suggests a system where stakeholder perspectives are not only gathered but also actively integrated into the evaluation and calculation of the preferred option. The "LLM" component likely handles complex data analysis and potentially provides insights to inform the weighting of criteria and evaluation of options. The diagram is a high-level overview and lacks details on the specific methods used for consolidation, weighting, calculation, and statistical analysis.