## Pie Chart: Music Tasks - 16K
### Overview
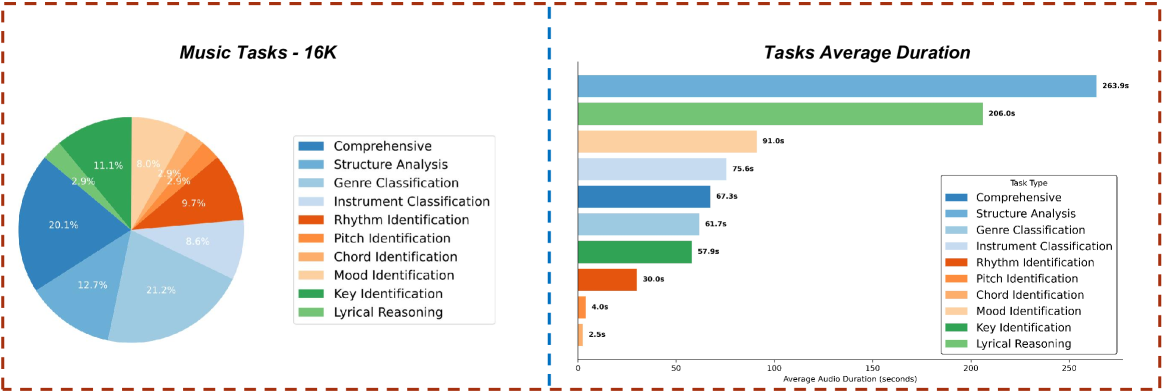
A circular pie chart displaying the distribution of music-related tasks across 16,000 instances. Each slice represents a task type with a percentage and color-coded legend.
### Components/Axes
- **Legend**: Positioned on the right of the pie chart. Colors map to task types:
- Blue: Comprehensive
- Light Blue: Structure Analysis
- Sky Blue: Genre Classification
- Light Blue: Instrument Classification
- Red: Rhythm Identification
- Orange: Pitch Identification
- Light Orange: Chord Identification
- Peach: Mood Identification
- Green: Key Identification
- Dark Green: Lyrical Reasoning
- **Slices**: Labeled with percentages (e.g., "20.1%", "12.7%") and task names.
### Detailed Analysis
- **Comprehensive**: 20.1% (blue)
- **Structure Analysis**: 12.7% (light blue)
- **Genre Classification**: 21.2% (sky blue)
- **Instrument Classification**: 8.6% (light blue)
- **Rhythm Identification**: 9.7% (red)
- **Pitch Identification**: 7.9% (orange)
- **Chord Identification**: 4.0% (light orange)
- **Mood Identification**: 8.0% (peach)
- **Key Identification**: 11.1% (green)
- **Lyrical Reasoning**: 2.9% (dark green)
### Key Observations
- **Genre Classification** is the most frequent task (21.2%).
- **Lyrical Reasoning** is the least frequent (2.9%).
- **Comprehensive** and **Structure Analysis** are the second and third most common tasks.
### Interpretation
The pie chart highlights that **Genre Classification** dominates task frequency, while **Lyrical Reasoning** is rare. The distribution suggests a focus on foundational music analysis tasks, with complex tasks like **Comprehensive** and **Lyrical Reasoning** being less common but potentially more time-intensive.
---
## Bar Chart: Tasks Average Duration
### Overview
A horizontal bar chart showing the average duration (in seconds) for each music task. Colors align with the pie chart legend.
### Components/Axes
- **Y-Axis**: Task types (e.g., "Comprehensive", "Lyrical Reasoning").
- **X-Axis**: Average duration in seconds (0–275 range).
- **Legend**: Matches pie chart colors for task types.
### Detailed Analysis
- **Comprehensive**: 263.9s (blue)
- **Lyrical Reasoning**: 206.0s (dark green)
- **Mood Identification**: 91.0s (peach)
- **Structure Analysis**: 75.6s (light blue)
- **Instrument Classification**: 67.3s (light blue)
- **Genre Classification**: 61.7s (sky blue)
- **Key Identification**: 57.9s (green)
- **Rhythm Identification**: 30.0s (red)
- **Pitch Identification**: 4.0s (orange)
- **Chord Identification**: 2.5s (light orange)
### Key Observations
- **Comprehensive** has the longest average duration (263.9s).
- **Chord Identification** is the shortest (2.5s).
- **Lyrical Reasoning** (206.0s) is the second-longest despite low frequency.
### Interpretation
The bar chart reveals a stark contrast between task frequency and duration. While **Genre Classification** is the most common, **Comprehensive** and **Lyrical Reasoning** consume the most time. This suggests that rare, complex tasks disproportionately impact workflow efficiency. Optimizing these high-duration tasks could yield significant time savings.
---
## Cross-Chart Correlation
- **Color Consistency**: Both charts use identical color coding for task types, ensuring alignment.
- **Discrepancy**: **Lyrical Reasoning** is rare (2.9%) but has the second-longest duration (206.0s), indicating it is resource-intensive when performed.
- **Outlier**: **Comprehensive** (20.1% frequency, 263.9s duration) is both common and time-consuming, highlighting its critical role in workflows.
## Final Notes
The data underscores the need to balance task frequency and duration in music analysis workflows. Prioritizing efficiency for high-duration tasks like **Comprehensive** and **Lyrical Reasoning** could improve overall productivity.