## [Line Graph]: Evolution of φ(π) Over Time
### Overview
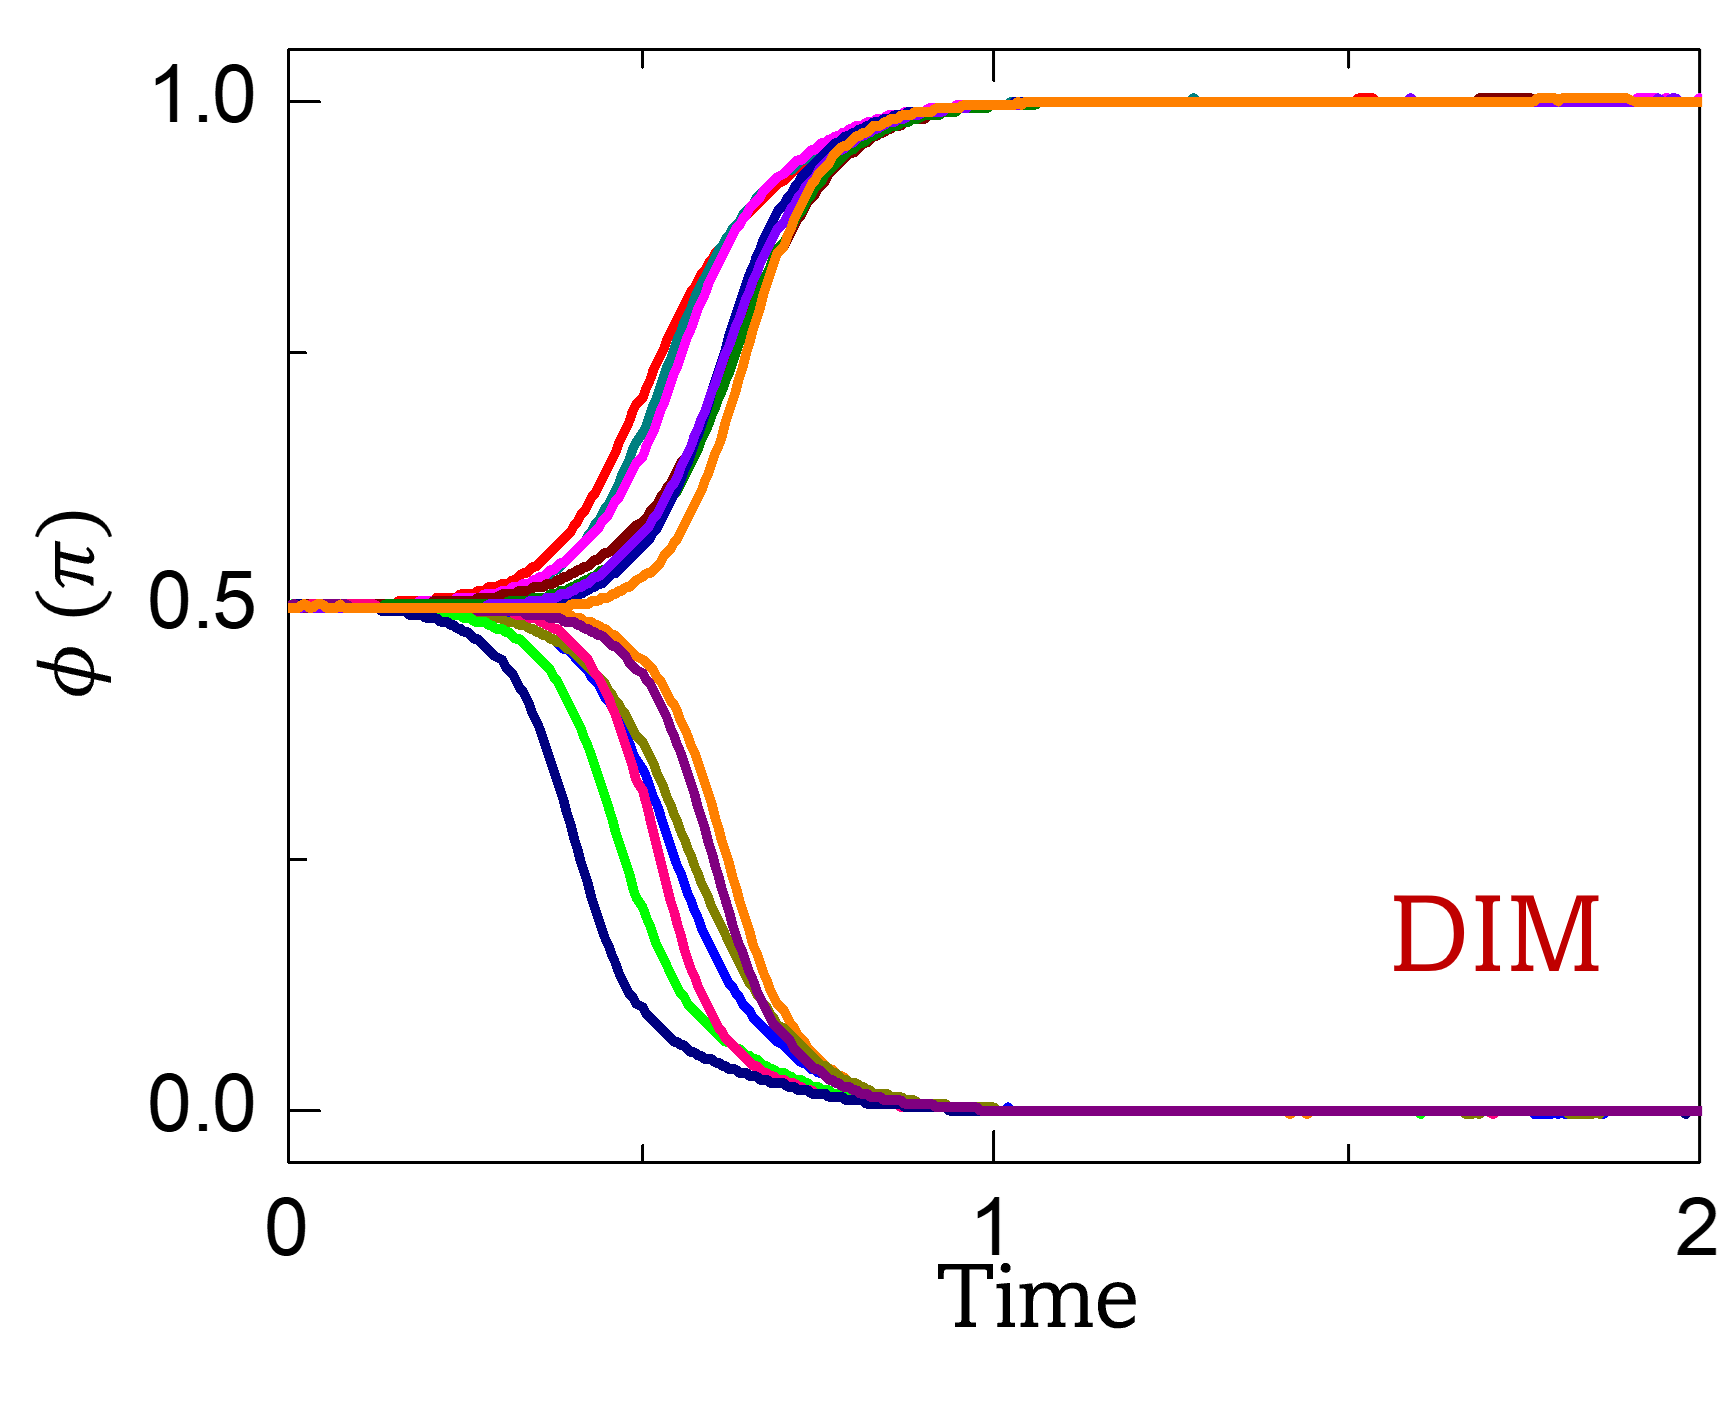
The image is a time-series line graph depicting the evolution of the variable \( \boldsymbol{\phi(\pi)} \) (phi of pi) over time (ranging from 0 to 2, units unspecified). Multiple colored curves represent distinct data series, all originating near \( \phi(\pi) \approx 0.5 \) at Time = 0. The curves diverge: some increase toward \( \phi(\pi) = 1.0 \), while others decrease toward \( \phi(\pi) = 0.0 \), converging around Time = 1. After Time = 1, most curves stabilize near 1.0 or 0.0 (with minor fluctuations). The text “DIM” (in red) appears in the bottom-right quadrant of the plot.
### Components/Axes
- **X-axis (Horizontal)**:
- Label: “Time”
- Ticks: 0, 1, 2 (range: 0 to 2; units not specified, likely normalized or arbitrary).
- **Y-axis (Vertical)**:
- Label: “\( \phi(\pi) \)” (Greek letter phi, with \( \pi \) in parentheses).
- Ticks: 0.0, 0.5, 1.0 (range: 0 to 1).
- **Curves**: Multiple colored lines (e.g., red, green, blue, purple, orange) with distinct trajectories. No explicit legend, but colors differentiate data series.
- **Text Annotation**: “DIM” (red, bottom-right of the plot area).
### Detailed Analysis
- **Initial Condition (Time = 0)**: All curves start at \( \phi(\pi) \approx 0.5 \) (y-axis value ~0.5).
- **Divergence (Time 0 to ~1)**:
- Some curves (e.g., red, green, blue, purple) **increase** toward \( \phi(\pi) = 1.0 \).
- Other curves (e.g., dark blue, green, purple) **decrease** toward \( \phi(\pi) = 0.0 \).
- The transition occurs around Time = 1, where curves converge (cross or meet) before stabilizing.
- **Stabilization (Time > 1)**:
- Curves that increased stabilize near \( \phi(\pi) = 1.0 \) (with minor fluctuations).
- Curves that decreased stabilize near \( \phi(\pi) = 0.0 \) (with minor fluctuations).
- **Text “DIM”**: Positioned in the bottom-right quadrant of the plot, likely a label (e.g., model name, method, or condition).
### Key Observations
- **Bifurcation Behavior**: The system (represented by \( \phi(\pi) \)) exhibits a **bifurcation** around Time = 1, where trajectories split into two stable states (\( \phi(\pi) \approx 0 \) and \( \phi(\pi) \approx 1 \)).
- **Convergence at Time = 1**: All curves meet or cross near Time = 1, indicating a critical time point where the system’s behavior shifts.
- **Stability Post-Time = 1**: After Time = 1, the system reaches stable equilibria (0 or 1) with minimal variation, suggesting a steady state.
- **Color Differentiation**: Multiple colors (red, green, blue, purple, orange, etc.) distinguish data series, though no legend maps colors to specific conditions.
### Interpretation
The graph likely models a **dynamical system** (e.g., phase transition, synchronization, or decision-making) where \( \phi(\pi) \) is a state variable. The initial condition (\( \phi(\pi) \approx 0.5 \)) is unstable, leading to a bifurcation: some trajectories evolve to a “high” state (\( \phi(\pi) \approx 1 \)) and others to a “low” state (\( \phi(\pi) \approx 0 \)). The critical time (Time = 1) marks the shift from transient to steady-state behavior. The “DIM” annotation may refer to a model (e.g., “Dynamical Ising Model”) or experimental condition. The lack of a legend suggests colors represent different initial conditions, parameters, or realizations, all converging to two stable states post-bifurcation—typical of **bistable systems** where small differences in inputs lead to divergent long-term outcomes.
(Note: No other languages are present in the image; all text is in English.)