## Chart: Daily Return and Run Length Analysis (1973-1975)
### Overview
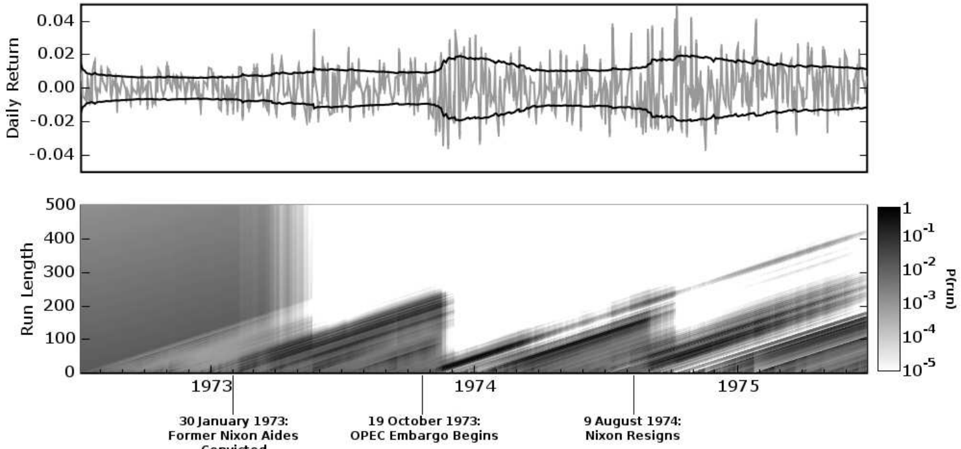
The image presents two plots. The top plot shows the daily return fluctuating around zero, with upper and lower bounds indicated by black lines. The bottom plot is a heatmap showing the probability of run length over time, with specific events marked along the x-axis.
### Components/Axes
**Top Plot:**
* **Y-axis:** Daily Return, ranging from -0.04 to 0.04 with increments of 0.02.
* **X-axis:** Time (implicit, but spans approximately 1973-1975, matching the bottom plot).
* **Data:** A fluctuating gray line representing the daily return. Two black lines represent upper and lower bounds.
**Bottom Plot:**
* **Y-axis:** Run Length, ranging from 0 to 500 with increments of 100.
* **X-axis:** Time, spanning from approximately 1973 to 1975.
* **Color Scale (right side):** P(run), ranging from 1 to 10^-5 on a logarithmic scale. Darker shades represent higher probabilities.
* **Events (marked on the x-axis):**
* 30 January 1973: Former Nixon Aides Convicted
* 19 October 1973: OPEC Embargo Begins
* 9 August 1974: Nixon Resigns
### Detailed Analysis
**Top Plot (Daily Return):**
* The gray line fluctuates around 0.00.
* The black lines representing the upper and lower bounds appear to widen slightly around mid-1974.
* The daily return fluctuates between approximately -0.02 and 0.02 for most of the period.
**Bottom Plot (Run Length Probability):**
* The heatmap shows diagonal lines, indicating the probability of different run lengths over time.
* The probability generally decreases as the run length increases.
* There are vertical bands of higher probability that seem to start at the time of the events marked on the x-axis.
* Before January 1973, the probability of longer run lengths is relatively high.
* After January 1973, the probability of longer run lengths decreases significantly.
* After the OPEC embargo in October 1973, the probability of longer run lengths increases again, but not as high as before January 1973.
* After Nixon's resignation in August 1974, the probability of longer run lengths increases again.
### Key Observations
* The daily return fluctuates around zero, with some periods of increased volatility.
* The probability of longer run lengths appears to be affected by major political and economic events.
* The period before January 1973 shows a higher probability of longer run lengths compared to the rest of the period.
### Interpretation
The plots suggest a relationship between major political and economic events and the probability of run lengths in the market. The conviction of Nixon's aides, the OPEC embargo, and Nixon's resignation all appear to coincide with changes in the probability of longer run lengths. This could indicate that these events introduced uncertainty or instability into the market, affecting the persistence of trends. The daily return plot provides context, showing the volatility of the market during this period. The higher probability of longer run lengths before January 1973 might indicate a period of greater stability or predictability in the market before the events of the Watergate scandal and the oil crisis.