## Chart: Time Series of Daily Return and Run Length Heatmap
### Overview
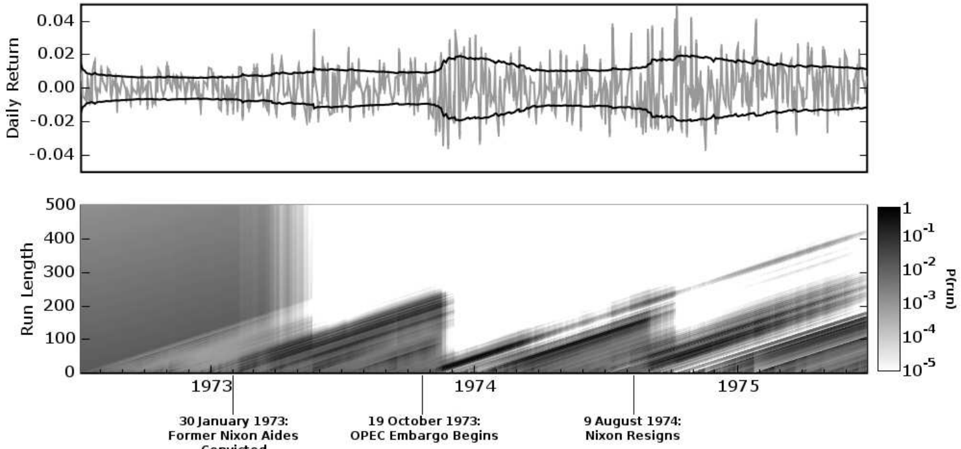
The image presents two charts stacked vertically. The top chart is a time series plot of daily returns, while the bottom chart is a heatmap showing the probability (Pr(run)) as a function of run length and time. The bottom chart includes vertical lines marking significant historical events: the involvement of former Nixon aides (January 30, 1973), the beginning of the OPEC embargo (October 19, 1973), and Nixon's resignation (August 9, 1974).
### Components/Axes
**Top Chart:**
* **Y-axis:** Daily Return (ranging approximately from -0.04 to 0.04).
* **X-axis:** Time (unlabeled, but spanning approximately 1973 to 1975).
* **Data Series:** A single line representing the daily return. A shaded area around the line indicates variability.
**Bottom Chart:**
* **Y-axis:** Run Length (ranging from 0 to 500).
* **X-axis:** Time (labeled with years 1973, 1974, and 1975).
* **Color Scale (Right):** Probability (Pr(run)) on a logarithmic scale, ranging from 10<sup>-5</sup> to 10<sup>1</sup>. Darker shades represent higher probabilities.
* **Vertical Lines:** Marking events: "30 January 1973: Former Nixon Aides Committed", "19 October 1973: OPEC Embargo Begins", "9 August 1974: Nixon Resigns".
### Detailed Analysis or Content Details
**Top Chart:**
The daily return line fluctuates around a slightly positive value. Initially, around 1973, the line oscillates with a relatively small amplitude (approximately +/- 0.01). Around October 1973, the volatility increases significantly, with larger positive and negative excursions. After 1974, the volatility decreases again, and the line settles into a more stable pattern, still fluctuating but with a smaller amplitude. The average daily return appears to be around 0.015.
**Bottom Chart:**
The heatmap shows the probability of a run of a given length at a given time.
* **1973:** The probability of runs is generally low (lighter shades) across all run lengths. There is a slight increase in probability for shorter runs (below 100) around the time of the Nixon aides event.
* **1973-1974 (OPEC Embargo):** A significant brightening (increase in probability) is visible for runs of intermediate length (approximately 100-300) starting around October 1973. This indicates a higher probability of sustained positive or negative trends during this period. The peak probability appears to be around a run length of 200, with a probability of approximately 10<sup>-2</sup> to 10<sup>-1</sup>.
* **1974-1975 (Post-Embargo):** The probability of longer runs (above 300) increases gradually, reaching higher values (darker shades) by 1975. The probability of runs of length 400-500 is approximately 10<sup>-3</sup> to 10<sup>-2</sup>.
### Key Observations
* The OPEC embargo in October 1973 coincides with a marked increase in the probability of intermediate-length runs in the bottom chart, suggesting increased market persistence during that period.
* The volatility in the daily return (top chart) is highest around the time of the OPEC embargo, corroborating the increased persistence observed in the heatmap.
* The probability of longer runs increases over time, indicating a trend towards more sustained market movements in the post-embargo period.
* The Nixon Resignation event does not appear to have a strong immediate impact on the run length probabilities.
### Interpretation
The charts suggest that the OPEC embargo of 1973 was a significant disruptive event for the market. The increased volatility in daily returns and the higher probability of intermediate-length runs indicate that the market became more prone to sustained trends during and immediately after the embargo. The gradual increase in the probability of longer runs in the post-embargo period may reflect a shift towards more stable, long-term market dynamics. The heatmap provides a visual representation of the market's tendency to exhibit runs of consecutive positive or negative returns, and how this tendency changed over time in response to major historical events. The data suggests that external shocks, like the OPEC embargo, can significantly alter market behavior and increase the likelihood of sustained trends. The lack of a strong signal around the Nixon Resignation suggests that this event, while politically significant, had a less direct impact on market persistence.