## Line Chart: Number of Responsive Plugs Over Time
### Overview
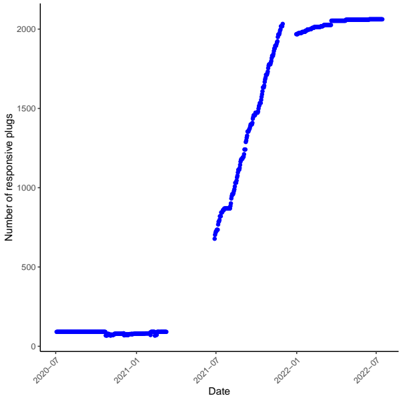
The image is a line chart showing the number of responsive plugs over time. The x-axis represents the date, ranging from approximately July 2020 to July 2022. The y-axis represents the number of responsive plugs, ranging from 0 to 2000. The data shows a period of relative stability followed by a rapid increase and then a plateau.
### Components/Axes
* **X-axis:** Date, with markers at approximately July 2020, January 2021, July 2021, January 2022, and July 2022.
* **Y-axis:** Number of responsive plugs, with markers at 0, 500, 1000, 1500, and 2000.
* **Data Series:** A single blue line representing the number of responsive plugs over time.
### Detailed Analysis
* **July 2020 - July 2021:** The number of responsive plugs remains relatively constant at approximately 100.
* **July 2021 - January 2022:** The number of responsive plugs increases rapidly from approximately 700 to 2000.
* **January 2022 - July 2022:** The number of responsive plugs plateaus, fluctuating slightly around 2000.
Specific data points (approximate):
* July 2020: ~100
* January 2021: ~100
* July 2021: ~700
* January 2022: ~2000
* July 2022: ~2050
### Key Observations
* The number of responsive plugs remained relatively stable for the first year.
* There was a significant increase in the number of responsive plugs between July 2021 and January 2022.
* The growth in the number of responsive plugs slowed down significantly after January 2022.
### Interpretation
The chart suggests that there was a period of slow adoption of responsive plugs, followed by a period of rapid growth, and then a period of saturation or slower growth. The rapid increase between July 2021 and January 2022 could be due to a successful marketing campaign, a change in technology, or other factors. The plateau after January 2022 could indicate that the market for responsive plugs is becoming saturated, or that there are other factors limiting growth.