## Line Chart: Number of Responsive Plugs Over Time
### Overview
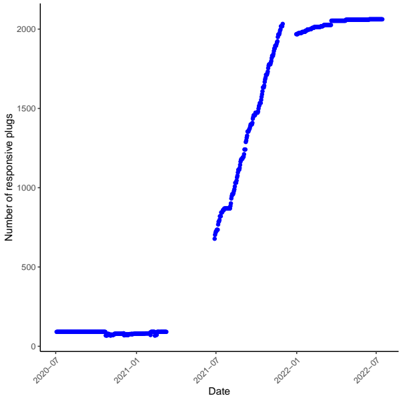
The image displays a line chart tracking the "Number of responsive plugs" over a period from approximately July 2020 to July 2022. The data is represented by a single, thick blue line plotted against a white background with black axes. The chart shows a period of low, stable numbers followed by a dramatic, near-vertical increase and a final plateau.
### Components/Axes
* **Chart Type:** Single-series line chart.
* **X-Axis (Horizontal):**
* **Label:** "Date"
* **Scale:** Chronological, with major tick marks labeled at six-month intervals.
* **Markers (from left to right):** `2020-07`, `2021-01`, `2021-07`, `2022-01`, `2022-07`.
* **Y-Axis (Vertical):**
* **Label:** "Number of responsive plugs"
* **Scale:** Linear, with major tick marks at intervals of 500.
* **Markers (from bottom to top):** `0`, `500`, `1000`, `1500`, `2000`.
* **Data Series:**
* **Color:** Solid blue.
* **Legend:** Not present, as there is only one data series.
* **Spatial Layout:** The chart occupies the majority of the image. The y-axis label is positioned vertically along the left edge. The x-axis label is centered below the date markers. The data line originates in the bottom-left quadrant and terminates in the top-right quadrant.
### Detailed Analysis
The blue line exhibits three distinct phases:
1. **Phase 1: Low Stability (Approx. July 2020 - June 2021)**
* **Trend:** The line is nearly horizontal, showing minimal fluctuation.
* **Data Points:** The value remains consistently low, hovering just above the `0` mark. Visually, it appears to be in the range of approximately **50 to 150** responsive plugs. There is a very slight dip visible around January 2021.
2. **Phase 2: Rapid Ascent (Approx. July 2021 - January 2022)**
* **Trend:** The line slopes upward at an extremely steep, almost vertical angle, indicating explosive growth.
* **Data Points:**
* The sharp increase begins around July 2021, starting from the ~100 level.
* By approximately September/October 2021, the line crosses the `500` mark.
* It crosses the `1000` mark around November/December 2021.
* It reaches the `1500` mark around January 2022.
* The steepest part of the climb occurs between ~1000 and ~2000.
3. **Phase 3: High Plateau (Approx. January 2022 - July 2022)**
* **Trend:** The line's ascent halts abruptly, transitioning to a near-horizontal plateau with very minor fluctuations.
* **Data Points:** The value stabilizes at a high level, appearing to be just at or slightly above the `2000` mark. The line shows a very slight downward wobble before leveling off completely by the end of the chart period (July 2022).
### Key Observations
* **The Inflection Point:** The most significant feature is the dramatic change in trend around **July 2021**. The shift from stagnation to hyper-growth is sudden and pronounced.
* **Growth Magnitude:** The number of responsive plugs increased by approximately **20-fold** (from ~100 to ~2000) within a span of about 6-7 months.
* **Plateau Characteristic:** After the rapid growth phase, the metric does not decline but instead maintains its new, high baseline, suggesting a new steady state was achieved.
* **Data Density:** The line appears to be constructed from a high-frequency dataset (e.g., daily or weekly), given its continuous, slightly jagged appearance, especially during the growth phase.
### Interpretation
This chart tells a story of a technology or service ("responsive plugs") that existed in a limited, stable state for about a year before experiencing a period of **mass adoption or deployment** starting in mid-2021. The near-vertical growth curve is characteristic of a viral adoption event, a major product launch, a successful marketing campaign, or a regulatory/infrastructure change that suddenly made the technology viable or necessary.
The subsequent plateau at ~2000 units suggests the market or deployment reached **saturation** for the given context, or that production/capacity limits were hit. The lack of a decline indicates sustained usage rather than a temporary spike. The data implies that whatever catalyst occurred in July 2021 was highly effective and resulted in a permanent, significant expansion of the "responsive plugs" ecosystem. The initial year of stability may represent a pilot phase, early adopter period, or a time before the key enabling factor was introduced.