## Heatmap: Dataset Performance Comparison
### Overview
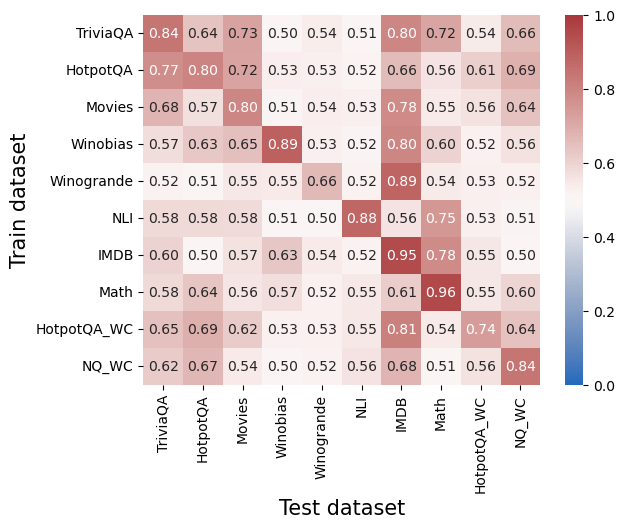
The image is a heatmap visualizing the performance of different datasets when used for training and testing machine learning models. The rows represent the datasets used for training, and the columns represent the datasets used for testing. The color intensity of each cell indicates the performance score, ranging from 0.0 (blue) to 1.0 (red).
### Components/Axes
* **Y-axis (Train dataset):** Lists the datasets used for training the models. The categories are: TriviaQA, HotpotQA, Movies, Winobias, Winogrande, NLI, IMDB, Math, HotpotQA\_WC, NQ\_WC.
* **X-axis (Test dataset):** Lists the datasets used for testing the models. The categories are: TriviaQA, HotpotQA, Movies, Winobias, Winogrande, NLI, IMDB, Math, HotpotQA\_WC, NQ\_WC.
* **Color Scale:** A vertical color bar on the right side of the heatmap, ranging from 0.0 (blue) to 1.0 (red), indicating the performance score.
* **Numerical Values:** Each cell contains a numerical value representing the performance score for the corresponding train/test dataset combination.
### Detailed Analysis
Here's a breakdown of the performance scores for each train/test dataset combination:
| Train Dataset | TriviaQA | HotpotQA | Movies | Winobias | Winogrande | NLI | IMDB | Math | HotpotQA\_WC | NQ\_WC |
|---------------|----------|----------|--------|----------|------------|-----|------|------|---------------|--------|
| TriviaQA | 0.84 | 0.64 | 0.73 | 0.50 | 0.54 | 0.51 | 0.80 | 0.72 | 0.54 | 0.66 |
| HotpotQA | 0.77 | 0.80 | 0.72 | 0.53 | 0.53 | 0.52 | 0.66 | 0.56 | 0.61 | 0.69 |
| Movies | 0.68 | 0.57 | 0.80 | 0.51 | 0.54 | 0.53 | 0.78 | 0.55 | 0.56 | 0.64 |
| Winobias | 0.57 | 0.63 | 0.65 | 0.89 | 0.53 | 0.52 | 0.80 | 0.60 | 0.52 | 0.56 |
| Winogrande | 0.52 | 0.51 | 0.55 | 0.55 | 0.66 | 0.52 | 0.89 | 0.54 | 0.53 | 0.52 |
| NLI | 0.58 | 0.58 | 0.58 | 0.51 | 0.50 | 0.88 | 0.56 | 0.75 | 0.53 | 0.51 |
| IMDB | 0.60 | 0.50 | 0.57 | 0.63 | 0.54 | 0.52 | 0.95 | 0.78 | 0.55 | 0.50 |
| Math | 0.58 | 0.64 | 0.56 | 0.57 | 0.52 | 0.55 | 0.61 | 0.96 | 0.55 | 0.60 |
| HotpotQA\_WC | 0.65 | 0.69 | 0.62 | 0.53 | 0.53 | 0.55 | 0.81 | 0.54 | 0.74 | 0.64 |
| NQ\_WC | 0.62 | 0.67 | 0.54 | 0.50 | 0.52 | 0.56 | 0.68 | 0.51 | 0.56 | 0.84 |
### Key Observations
* The diagonal elements (where train and test datasets are the same) generally have higher performance scores, indicating that models perform best when tested on data similar to what they were trained on.
* IMDB and Math datasets show particularly high performance when used to train models that are then tested on themselves (0.95 and 0.96 respectively).
* Winobias and Winogrande also show high performance when trained and tested on themselves (0.89 and 0.66 respectively).
* NLI shows high performance when trained and tested on itself (0.88).
* TriviaQA shows high performance when trained and tested on itself (0.84).
* HotpotQA shows high performance when trained and tested on itself (0.80).
* Movies shows high performance when trained and tested on itself (0.80).
* NQ\_WC shows high performance when trained and tested on itself (0.84).
* The lowest performance scores are generally observed when models trained on one dataset are tested on a different dataset, indicating domain shift or differences in data characteristics.
### Interpretation
The heatmap provides insights into the transferability of machine learning models across different datasets. High scores along the diagonal suggest that models are well-suited for their respective datasets. Off-diagonal scores indicate how well a model trained on one dataset generalizes to another. The lower scores in the off-diagonal elements suggest that there are significant differences between the datasets, making it difficult for models to generalize effectively. The high self-performance of IMDB and Math datasets could be attributed to their specific characteristics or the nature of the tasks they represent. The heatmap can be used to inform decisions about dataset selection and model training strategies, such as fine-tuning models on target datasets to improve performance.