## Heatmap: Train/Test Dataset Performance Correlation
### Overview
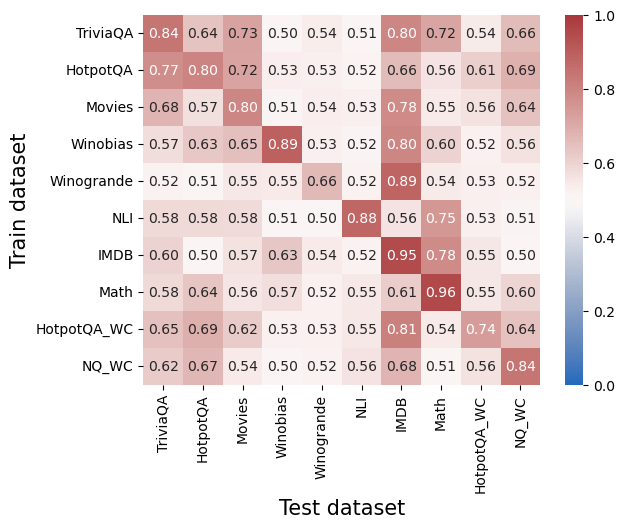
This image presents a heatmap visualizing the correlation between different training datasets and test datasets. The color intensity represents the correlation coefficient, ranging from 0.0 to 1.0. The heatmap displays the performance of models trained on one dataset and evaluated on another.
### Components/Axes
* **X-axis:** Test dataset. Categories are: TriviaQA, HotpotQA, Movies, Winobias, Winogrande, NLI, IMDB, Math, HotpotQA\_WC, NQ\_WC.
* **Y-axis:** Train dataset. Categories are: TriviaQA, HotpotQA, Movies, Winobias, Winogrande, NLI, IMDB, Math, HotpotQA\_WC, NQ\_WC.
* **Color Scale (Legend):** Located on the right side of the heatmap. Ranges from blue (0.0) to red (1.0), representing negative to positive correlation.
* 0.0: Blue
* 0.2: Light Blue
* 0.4: Medium Blue
* 0.6: Light Red
* 0.8: Medium Red
* 1.0: Dark Red
### Detailed Analysis
The heatmap shows the correlation coefficients between each pair of train and test datasets. I will analyze row by row, noting trends and specific values.
* **TriviaQA (Train):**
* TriviaQA (Test): 0.84
* HotpotQA (Test): 0.64
* Movies (Test): 0.73
* Winobias (Test): 0.50
* Winogrande (Test): 0.54
* NLI (Test): 0.51
* IMDB (Test): 0.80
* Math (Test): 0.72
* HotpotQA\_WC (Test): 0.54
* NQ\_WC (Test): 0.66
* **HotpotQA (Train):**
* TriviaQA (Test): 0.77
* HotpotQA (Test): 0.80
* Movies (Test): 0.72
* Winobias (Test): 0.53
* Winogrande (Test): 0.53
* NLI (Test): 0.52
* IMDB (Test): 0.66
* Math (Test): 0.56
* HotpotQA\_WC (Test): 0.61
* NQ\_WC (Test): 0.69
* **Movies (Train):**
* TriviaQA (Test): 0.68
* HotpotQA (Test): 0.57
* Movies (Test): 0.80
* Winobias (Test): 0.51
* Winogrande (Test): 0.54
* NLI (Test): 0.53
* IMDB (Test): 0.78
* Math (Test): 0.55
* HotpotQA\_WC (Test): 0.56
* NQ\_WC (Test): 0.64
* **Winobias (Train):**
* TriviaQA (Test): 0.57
* HotpotQA (Test): 0.63
* Movies (Test): 0.65
* Winobias (Test): 0.89
* Winogrande (Test): 0.53
* NLI (Test): 0.52
* IMDB (Test): 0.80
* Math (Test): 0.60
* HotpotQA\_WC (Test): 0.52
* NQ\_WC (Test): 0.56
* **Winogrande (Train):**
* TriviaQA (Test): 0.52
* HotpotQA (Test): 0.51
* Movies (Test): 0.55
* Winobias (Test): 0.55
* Winogrande (Test): 0.66
* NLI (Test): 0.52
* IMDB (Test): 0.89
* Math (Test): 0.54
* HotpotQA\_WC (Test): 0.53
* NQ\_WC (Test): 0.52
* **NLI (Train):**
* TriviaQA (Test): 0.58
* HotpotQA (Test): 0.58
* Movies (Test): 0.58
* Winobias (Test): 0.51
* Winogrande (Test): 0.50
* NLI (Test): 0.88
* IMDB (Test): 0.56
* Math (Test): 0.75
* HotpotQA\_WC (Test): 0.53
* NQ\_WC (Test): 0.51
* **IMDB (Train):**
* TriviaQA (Test): 0.60
* HotpotQA (Test): 0.50
* Movies (Test): 0.57
* Winobias (Test): 0.63
* Winogrande (Test): 0.54
* NLI (Test): 0.52
* IMDB (Test): 0.95
* Math (Test): 0.78
* HotpotQA\_WC (Test): 0.55
* NQ\_WC (Test): 0.50
* **Math (Train):**
* TriviaQA (Test): 0.58
* HotpotQA (Test): 0.64
* Movies (Test): 0.56
* Winobias (Test): 0.57
* Winogrande (Test): 0.52
* NLI (Test): 0.55
* IMDB (Test): 0.61
* Math (Test): 0.96
* HotpotQA\_WC (Test): 0.55
* NQ\_WC (Test): 0.60
* **HotpotQA\_WC (Train):**
* TriviaQA (Test): 0.65
* HotpotQA (Test): 0.69
* Movies (Test): 0.62
* Winobias (Test): 0.53
* Winogrande (Test): 0.53
* NLI (Test): 0.55
* IMDB (Test): 0.81
* Math (Test): 0.54
* HotpotQA\_WC (Test): 0.74
* NQ\_WC (Test): 0.64
* **NQ\_WC (Train):**
* TriviaQA (Test): 0.62
* HotpotQA (Test): 0.67
* Movies (Test): 0.54
* Winobias (Test): 0.52
* Winogrande (Test): 0.56
* NLI (Test): 0.56
* IMDB (Test): 0.68
* Math (Test): 0.51
* HotpotQA\_WC (Test): 0.56
* NQ\_WC (Test): 0.84
### Key Observations
* The diagonal elements (training and testing on the same dataset) all have a correlation of 1.0 (dark red), as expected.
* IMDB and Math show high correlation when used as both training and testing datasets (0.95 and 0.96 respectively).
* Winobias shows a relatively high correlation with itself (0.89).
* The correlations between TriviaQA and HotpotQA are consistently moderate (around 0.6-0.8).
* NLI, Winogrande, and HotpotQA\_WC generally exhibit lower correlations with other datasets.
### Interpretation
This heatmap demonstrates the transferability of knowledge learned from different datasets. High correlation coefficients indicate that a model trained on one dataset performs well on another, suggesting that the datasets share similar underlying characteristics or require similar reasoning abilities. The strong self-correlations confirm that models perform best when tested on data similar to what they were trained on.
The relatively low correlations involving NLI, Winogrande, and HotpotQA\_WC suggest that these datasets may be more specialized or require different skills than the other datasets. This could be due to differences in the types of questions asked, the complexity of the reasoning required, or the domain of knowledge tested.
The high correlation between IMDB and other datasets suggests that the features learned from IMDB are broadly applicable to other tasks. The moderate correlation between TriviaQA and HotpotQA suggests that these datasets share some commonalities, but also have distinct characteristics.
The heatmap provides valuable insights into the relationships between these datasets and can be used to guide the selection of training data for specific tasks. For example, if a model is intended to perform well on IMDB, training on IMDB itself or on datasets with high correlation to IMDB (like TriviaQA) would be a good strategy.