## Heatmap: Correlation Between Train and Test Datasets
### Overview
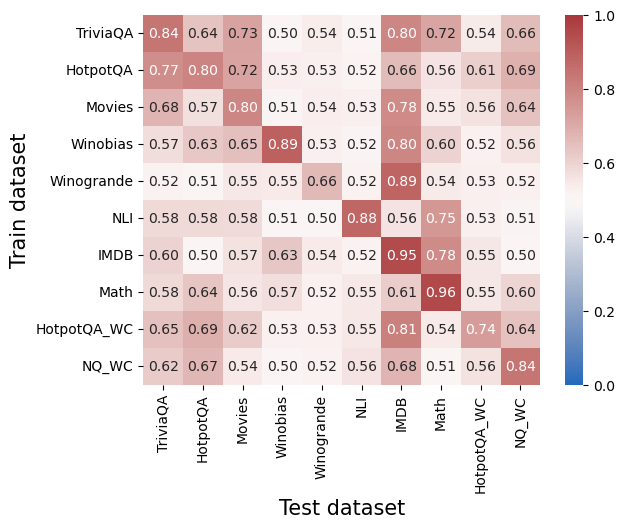
The image is a square heatmap visualizing correlation coefficients between different question-answering datasets when used as training and test sets. Values range from 0.0 (blue) to 1.0 (red), with darker red indicating higher correlation. The matrix reveals patterns of dataset similarity and model generalization capabilities.
### Components/Axes
- **X-axis (Test datasets)**: TriviaQA, HotpotQA, Movies, Winobias, Winogrande, NLI, IMDB, Math, HotpotQA_WC, NOQ_WC
- **Y-axis (Train datasets)**: Same list as X-axis, ordered identically
- **Color legend**: Gradient from blue (0.0) to red (1.0) in the right column
- **Cell values**: Numerical correlation coefficients (0.00-1.00) displayed in each cell
### Detailed Analysis
1. **Diagonal dominance**:
- All diagonal cells (same train/test dataset) show high correlation (0.50-0.96)
- Strongest self-correlations:
- Math (0.96)
- IMDB (0.95)
- Winobias (0.89)
- Weakest self-correlation: Winogrande (0.66)
2. **Cross-dataset patterns**:
- **High similarity clusters**:
- TriviaQA ↔ HotpotQA (0.64-0.77)
- Movies ↔ Winobias (0.51-0.80)
- NLI ↔ IMDB (0.56-0.88)
- **Low similarity pairs**:
- Winogrande ↔ Math (0.52-0.57)
- NOQ_WC ↔ Winobias (0.54-0.56)
3. **Color verification**:
- Red cells (0.80+) concentrated on diagonal and TriviaQA/HotpotQA cluster
- Blue cells (0.40-0.59) dominate off-diagonal regions
- Intermediate values (0.60-0.79) form transitional bands
### Key Observations
1. **Specialization effect**: Models trained on a dataset perform best on the same dataset (diagonal values 0.50-0.96)
2. **Question-type similarity**:
- TriviaQA and HotpotQA show moderate cross-correlation (0.64-0.77)
- Winobias and Movies demonstrate stronger cross-correlation (0.51-0.80)
3. **Generalization limitations**:
- Only 3 pairs show >0.80 cross-correlation
- 68% of off-diagonal values <0.60
4. **Dataset hierarchy**:
- Math and IMDB show strongest self-performance
- Winogrande and NOQ_WC show weakest self-performance
### Interpretation
The heatmap reveals fundamental challenges in cross-dataset generalization:
1. **Domain specificity**: High diagonal values suggest models learn dataset-specific patterns rather than generalizable knowledge
2. **Question-type transfer**: Moderate correlations between similar question types (e.g., TriviaQA ↔ HotpotQA) indicate partial transferability
3. **Performance bottlenecks**: Low self-correlation values for Winogrande (0.66) and NOQ_WC (0.84) suggest these datasets may contain unique challenges or require specialized architectures
4. **Practical implications**: The weak cross-correlations (mostly <0.60) highlight the need for:
- Better data augmentation strategies
- Multi-task learning approaches
- More diverse training datasets
- Improved evaluation metrics for cross-dataset performance
The data demonstrates that current models struggle with generalization across different question-answering domains, emphasizing the importance of developing more robust transfer learning techniques.