## Heatmap: AUROC for Projections Aᵀt
### Overview
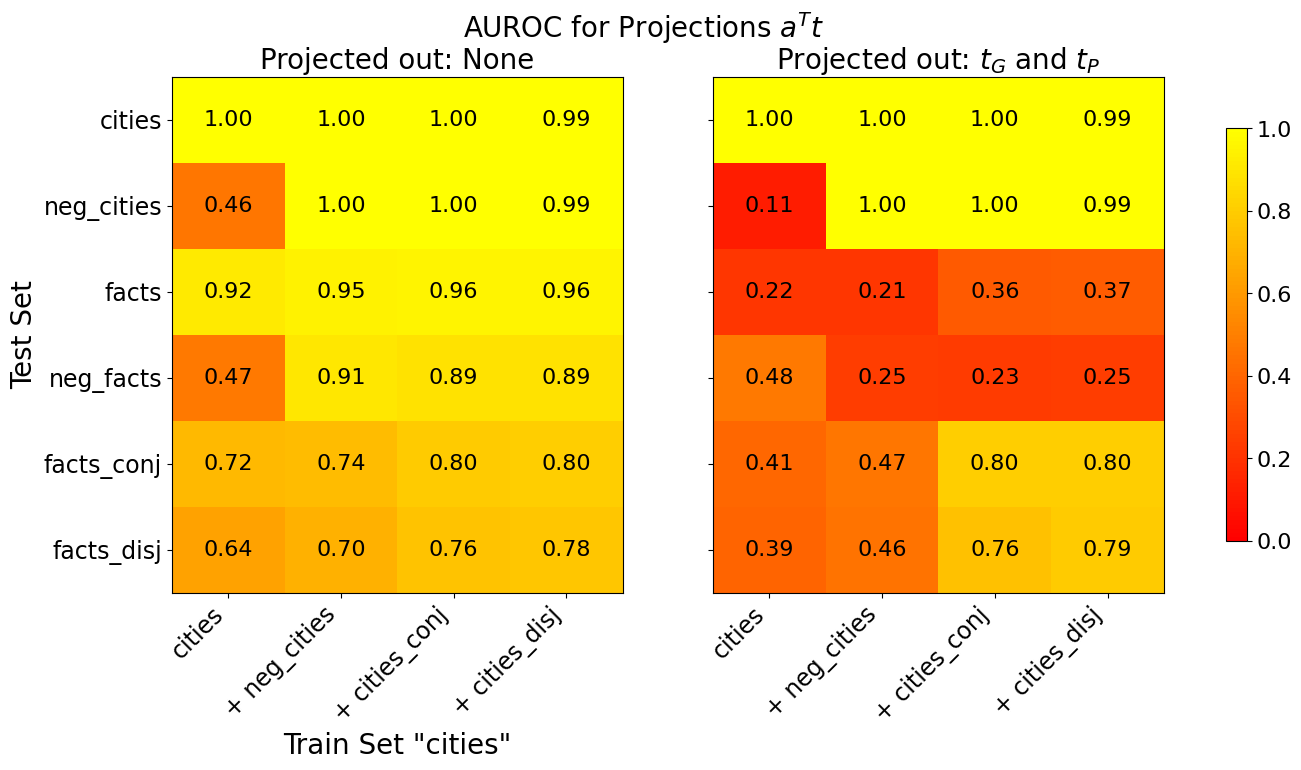
The image presents two heatmaps displaying Area Under the Receiver Operating Characteristic curve (AUROC) values for projections Aᵀt. The heatmaps compare performance across different train and test sets, with varying projection conditions. The first heatmap shows results when no projections are applied ("Projected out: None"), while the second shows results when projections based on τG and τP are applied ("Projected out: τG and τP"). The color scale ranges from red (0.0) to yellow (1.0), indicating AUROC performance.
### Components/Axes
* **Title:** "AUROC for Projections Aᵀt"
* **Subtitles:** "Projected out: None" (left heatmap) and "Projected out: τG and τP" (right heatmap)
* **X-axis (Train Set):** Categories: "cities", "+ neg\_cities", "+ cities\_conj", "+ cities\_disj"
* **Y-axis (Test Set):** Categories: "cities", "neg\_cities", "facts", "neg\_facts", "facts\_conj", "facts\_disj"
* **Color Scale:** Ranges from red (0.0) to yellow (1.0). The scale is positioned on the right side of the image.
* 0.0 is represented by dark red.
* 0.2 is represented by a lighter red.
* 0.4 is represented by orange.
* 0.6 is represented by a brighter orange.
* 0.8 is represented by yellow.
* 1.0 is represented by a bright yellow.
### Detailed Analysis or Content Details
**Heatmap 1: Projected out: None**
The heatmap shows AUROC values for different train/test set combinations without any projections.
* **cities vs. cities:** 1.00
* **cities vs. neg\_cities:** 0.46
* **cities vs. facts:** 0.92
* **cities vs. neg\_facts:** 0.47
* **cities vs. facts\_conj:** 0.72
* **cities vs. facts\_disj:** 0.64
* **+ neg\_cities vs. cities:** 1.00
* **+ neg\_cities vs. neg\_cities:** 1.00
* **+ neg\_cities vs. facts:** 0.95
* **+ neg\_cities vs. neg\_facts:** 0.91
* **+ neg\_cities vs. facts\_conj:** 0.74
* **+ neg\_cities vs. facts\_disj:** 0.70
* **+ cities\_conj vs. cities:** 1.00
* **+ cities\_conj vs. neg\_cities:** 1.00
* **+ cities\_conj vs. facts:** 0.96
* **+ cities\_conj vs. neg\_facts:** 0.89
* **+ cities\_conj vs. facts\_conj:** 0.80
* **+ cities\_conj vs. facts\_disj:** 0.76
* **+ cities\_disj vs. cities:** 0.99
* **+ cities\_disj vs. neg\_cities:** 0.99
* **+ cities\_disj vs. facts:** 0.96
* **+ cities\_disj vs. neg\_facts:** 0.89
* **+ cities\_disj vs. facts\_conj:** 0.80
* **+ cities\_disj vs. facts\_disj:** 0.78
**Heatmap 2: Projected out: τG and τP**
The heatmap shows AUROC values for different train/test set combinations with projections based on τG and τP.
* **cities vs. cities:** 1.00
* **cities vs. neg\_cities:** 0.11
* **cities vs. facts:** 0.22
* **cities vs. neg\_facts:** 0.48
* **cities vs. facts\_conj:** 0.41
* **cities vs. facts\_disj:** 0.39
* **+ neg\_cities vs. cities:** 1.00
* **+ neg\_cities vs. neg\_cities:** 1.00
* **+ neg\_cities vs. facts:** 0.21
* **+ neg\_cities vs. neg\_facts:** 0.25
* **+ neg\_cities vs. facts\_conj:** 0.47
* **+ neg\_cities vs. facts\_disj:** 0.46
* **+ cities\_conj vs. cities:** 1.00
* **+ cities\_conj vs. neg\_cities:** 1.00
* **+ cities\_conj vs. facts:** 0.36
* **+ cities\_conj vs. neg\_facts:** 0.23
* **+ cities\_conj vs. facts\_conj:** 0.80
* **+ cities\_conj vs. facts\_disj:** 0.76
* **+ cities\_disj vs. cities:** 0.99
* **+ cities\_disj vs. neg\_cities:** 0.99
* **+ cities\_disj vs. facts:** 0.37
* **+ cities\_disj vs. neg\_facts:** 0.25
* **+ cities\_disj vs. facts\_conj:** 0.80
* **+ cities\_disj vs. facts\_disj:** 0.79
### Key Observations
* In the first heatmap ("Projected out: None"), performance is generally high (close to 1.0) when the train and test sets are the same (e.g., cities vs. cities). Performance drops significantly when testing on different categories (e.g., cities vs. neg\_cities).
* The second heatmap ("Projected out: τG and τP") shows a substantial decrease in performance across most combinations, particularly when the train and test sets differ. The values are generally lower than in the first heatmap.
* The "+ cities\_conj" and "+ cities\_disj" train sets consistently show better performance than the "+ neg\_cities" train set in the second heatmap, especially when tested against "facts\_conj" and "facts\_disj".
* The combination of "cities" as the train set and "neg\_cities" as the test set consistently yields low AUROC values in both heatmaps, indicating poor generalization.
### Interpretation
The data suggests that the projections based on τG and τP significantly degrade the ability of the model to generalize to different data distributions. While the model performs well when trained and tested on the same data (e.g., cities vs. cities), the performance drops dramatically when tested on different categories, especially after applying the projections.
The difference between the two heatmaps highlights the impact of the projections. The first heatmap demonstrates the baseline performance without projections, while the second shows how the projections affect the model's ability to discriminate between different categories. The lower AUROC values in the second heatmap indicate that the projections are likely removing information that is crucial for generalization.
The consistent performance of "+ cities\_conj" and "+ cities\_disj" suggests that these training sets capture some underlying structure that is helpful for distinguishing between different categories, even after applying the projections. The poor performance of "cities" vs. "neg\_cities" in both heatmaps suggests that these two categories are particularly difficult to distinguish, potentially due to overlapping features or a lack of clear separation in the data. The data suggests that the projections are exacerbating this issue.