\n
## Comparative Heatmap Chart: AUROC for Projections a^T t
### Overview
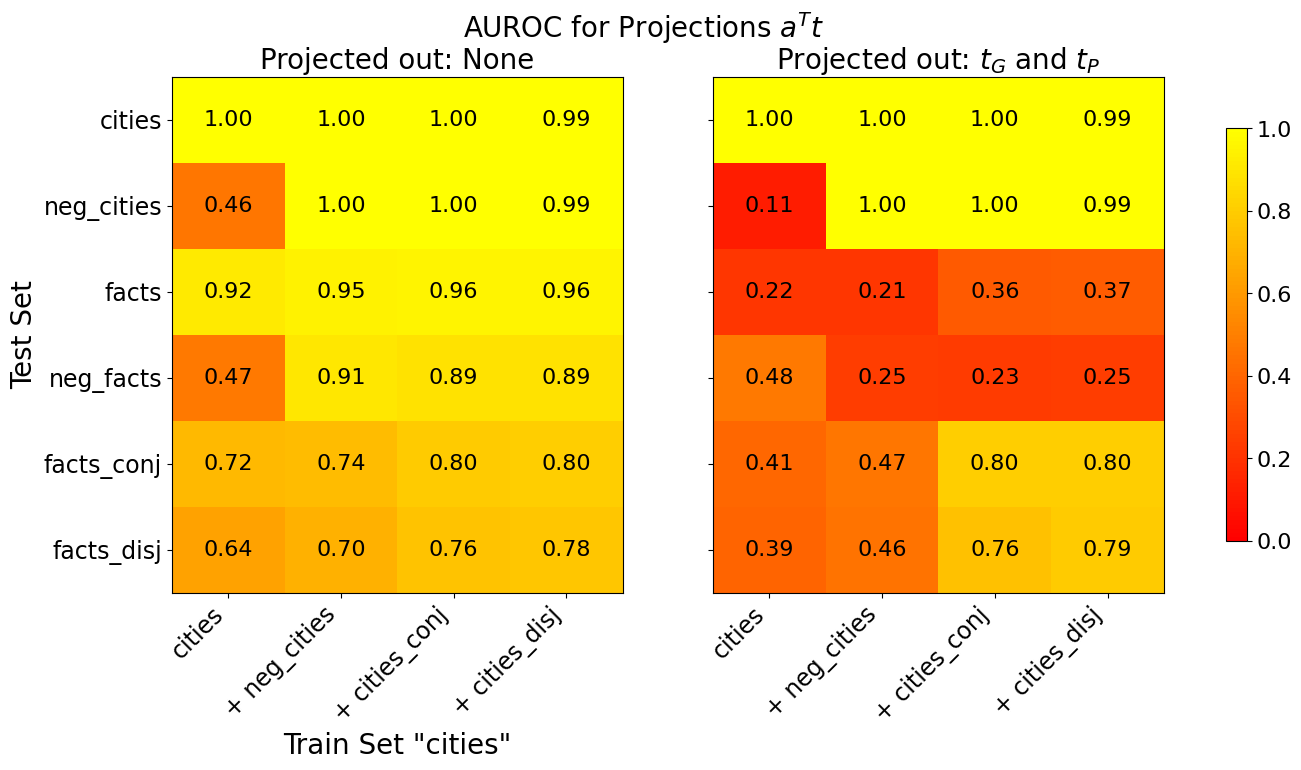
The image displays two side-by-side heatmaps comparing the Area Under the Receiver Operating Characteristic curve (AUROC) performance of a model under two different projection conditions. The overall title is "AUROC for Projections a^T t". The left heatmap shows results with "Projected out: None," and the right heatmap shows results with "Projected out: t_G and t_P." A shared color bar on the far right maps numerical AUROC values to a color gradient from red (0.0) to yellow (1.0).
### Components/Axes
* **Main Title:** "AUROC for Projections a^T t"
* **Left Heatmap Subtitle:** "Projected out: None"
* **Right Heatmap Subtitle:** "Projected out: t_G and t_P"
* **Y-Axis (Both Heatmaps):** Labeled "Test Set". Categories from top to bottom are:
* `cities`
* `neg_cities`
* `facts`
* `neg_facts`
* `facts_conj`
* `facts_disj`
* **X-Axis (Both Heatmaps):** Labeled "Train Set 'cities'". Categories from left to right are:
* `cities`
* `+ neg_cities`
* `+ cities_conj`
* `+ cities_disj`
* **Color Bar (Right Side):** A vertical gradient bar labeled from 0.0 (bottom, red) to 1.0 (top, yellow). Ticks are at 0.0, 0.2, 0.4, 0.6, 0.8, 1.0.
### Detailed Analysis
**Left Heatmap (Projected out: None):**
* **Row `cities`:** Values are uniformly high: [1.00, 1.00, 1.00, 0.99]. Color is bright yellow.
* **Row `neg_cities`:** First value is low (0.46, orange), followed by high values: [1.00, 1.00, 0.99].
* **Row `facts`:** Consistently high values: [0.92, 0.95, 0.96, 0.96]. Color is yellow.
* **Row `neg_facts`:** First value is low (0.47, orange), followed by high values: [0.91, 0.89, 0.89].
* **Row `facts_conj`:** Moderate to high values, increasing left to right: [0.72, 0.74, 0.80, 0.80]. Colors range from orange to yellow.
* **Row `facts_disj`:** Moderate values, increasing left to right: [0.64, 0.70, 0.76, 0.78]. Colors are orange to light orange.
**Right Heatmap (Projected out: t_G and t_P):**
* **Row `cities`:** Values remain uniformly high: [1.00, 1.00, 1.00, 0.99]. Color is bright yellow.
* **Row `neg_cities`:** First value is very low (0.11, red), followed by high values: [1.00, 1.00, 0.99].
* **Row `facts`:** Values are uniformly low: [0.22, 0.21, 0.36, 0.37]. Colors are red to orange.
* **Row `neg_facts`:** Values are uniformly low: [0.48, 0.25, 0.23, 0.25]. Colors are orange to red.
* **Row `facts_conj`:** First two values are low (0.41, 0.47 - orange), last two are high (0.80, 0.80 - yellow).
* **Row `facts_disj`:** First two values are low (0.39, 0.46 - orange), last two are high (0.76, 0.79 - yellow).
### Key Observations
1. **Robustness of `cities`:** The `cities` test set maintains near-perfect AUROC (~1.00) across all training set configurations and both projection conditions.
2. **Impact of Projection:** Projecting out `t_G` and `t_P` (right heatmap) causes a dramatic performance drop for test sets `facts`, `neg_facts`, and the first two training configurations of `facts_conj`/`facts_disj`. This suggests these components (`t_G`, `t_P`) are critical for the model's performance on fact-related tasks.
3. **Pattern in `neg_cities` and `neg_facts`:** In both heatmaps, the first column (trained only on `cities`) shows poor performance for the `neg_` test sets. Performance recovers when the training set is augmented with the corresponding negated data (`+ neg_cities`).
4. **Partial Recovery in Logical Forms:** For `facts_conj` and `facts_disj` in the right heatmap, performance recovers to high levels (0.76-0.80) only when the training set includes the corresponding logical form (`+ cities_conj`, `+ cities_disj`).
### Interpretation
This chart likely evaluates a model's ability to generalize or detect certain properties (measured by AUROC) when its representations are projected to remove specific components (`t_G` and `t_P`). The `cities` task appears to be solved by features independent of these components. In contrast, performance on fact-based reasoning (`facts`, `neg_facts`) heavily relies on the information contained in `t_G` and `t_P`, as removing them collapses performance to near-random levels (AUROC ~0.2-0.5). The recovery of performance for `facts_conj` and `facts_disj` only when trained on the matching logical structure suggests the model learns task-specific features from the training data that can compensate for the loss of `t_G` and `t_P`, but only for those specific logical forms. The consistent pattern for `neg_` test sets highlights the importance of including negated examples in training to achieve good performance on them.