## Heatmap: AUROC for Projections a^Tt
### Overview
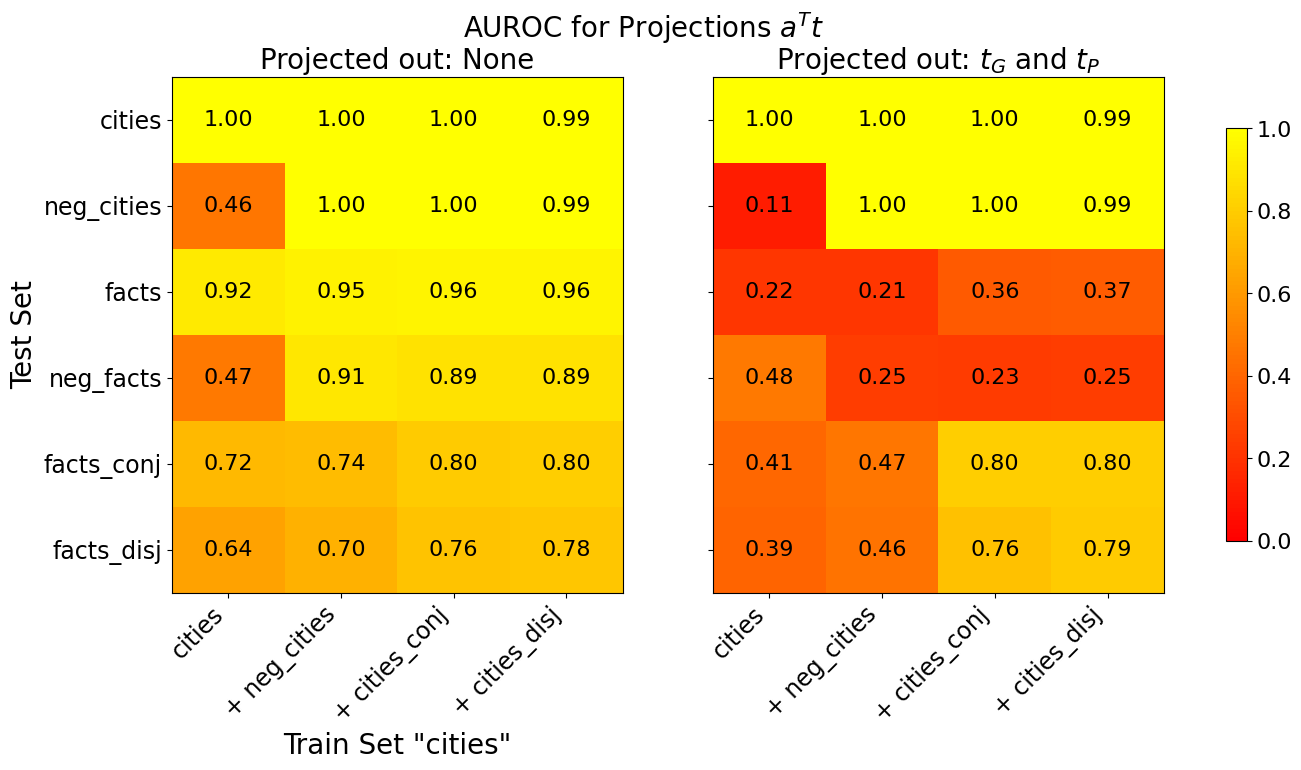
The image presents two side-by-side heatmaps comparing Area Under the Receiver Operating Characteristic (AUROC) values for different test and train set combinations under two projection scenarios: (1) no projections applied, and (2) projections of `t_G` and `t_P` applied. The heatmaps use a color gradient from red (low AUROC) to yellow (high AUROC), with a legend on the right indicating values from 0.0 to 1.0.
---
### Components/Axes
#### Labels and Structure
- **Main Title**: "AUROC for Projections a^Tt"
- **Subsections**:
- Left: "Projected out: None"
- Right: "Projected out: t_G and t_P"
- **Rows (Test Sets)**:
1. cities
2. neg_cities
3. facts
4. neg_facts
5. facts_conj
6. facts_disj
- **Columns (Train Sets)**:
1. cities
2. + neg_cities
3. + cities_conj
4. + cities_disj
- **Legend**: Vertical color bar on the right, labeled 0.0 (red) to 1.0 (yellow).
#### Spatial Grounding
- Legend is positioned to the right of both heatmaps.
- Row labels are on the left, column labels at the bottom.
- Subsection titles are centered above each heatmap.
---
### Detailed Analysis
#### AUROC Values
**Left Heatmap (No Projections)**:
| Test Set | cities | + neg_cities | + cities_conj | + cities_disj |
|----------------|--------|--------------|---------------|---------------|
| cities | 1.00 | 1.00 | 1.00 | 0.99 |
| neg_cities | 0.46 | 1.00 | 1.00 | 0.99 |
| facts | 0.92 | 0.95 | 0.96 | 0.96 |
| neg_facts | 0.47 | 0.91 | 0.89 | 0.89 |
| facts_conj | 0.72 | 0.74 | 0.80 | 0.80 |
| facts_disj | 0.64 | 0.70 | 0.76 | 0.78 |
**Right Heatmap (Projections of t_G and t_P)**:
| Test Set | cities | + neg_cities | + cities_conj | + cities_disj |
|----------------|--------|--------------|---------------|---------------|
| cities | 1.00 | 1.00 | 1.00 | 0.99 |
| neg_cities | 0.11 | 1.00 | 1.00 | 0.99 |
| facts | 0.22 | 0.21 | 0.36 | 0.37 |
| neg_facts | 0.48 | 0.25 | 0.23 | 0.25 |
| facts_conj | 0.41 | 0.47 | 0.80 | 0.80 |
| facts_disj | 0.39 | 0.46 | 0.76 | 0.79 |
#### Color Consistency
- Red values (e.g., 0.11, 0.21) align with the legend’s lower end.
- Yellow values (e.g., 1.00, 0.99) match the legend’s upper end.
---
### Key Observations
1. **Cities**:
- AUROC remains near-perfect (1.00–0.99) in both scenarios, indicating robust performance regardless of projections.
2. **neg_cities**:
- AUROC drops dramatically from 0.46 to 0.11 when projections are applied, suggesting sensitivity to `t_G`/`t_P` removal.
3. **facts**:
- AUROC decreases significantly (0.92 → 0.22) with projections, though recovery occurs in combined train sets (+ cities_conj/disj).
4. **neg_facts**:
- AUROC declines moderately (0.47 → 0.48) but stabilizes in combined train sets.
5. **facts_conj/disj**:
- AUROC improves in combined train sets (e.g., facts_conj: 0.72 → 0.80) when projections are applied.
---
### Interpretation
- **Projection Impact**: Removing `t_G` and `t_P` harms performance for **neg_cities** and **facts**, likely due to over-reliance on these features for distinguishing negative cases or factual relationships.
- **Robustness**: **cities** and **neg_facts** show resilience to projections, suggesting these categories depend less on `t_G`/`t_P`.
- **Train Set Combinations**: Adding `cities_conj` or `cities_disj` to the training set mitigates performance drops for **facts** and **neg_facts**, indicating that feature interactions improve generalization.
- **Anomaly**: The drastic drop in **neg_cities** AUROC (0.46 → 0.11) highlights a critical vulnerability when projections are applied, warranting further investigation into feature dependencies.
This analysis underscores the importance of careful feature selection and projection strategies in model training, particularly for sensitive categories like neg_cities and facts.