## Data Visualization Chart: Color-Coded Numerical Scale
### Overview
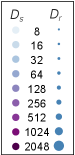
The image displays a vertical, two-column chart or legend that maps a series of numerical values to a specific color gradient. The chart is minimal, consisting solely of two labeled columns of numbers, each preceded by a colored square. There are no axes, titles, or explanatory text beyond the column headers.
### Components/Axes
* **Column Headers:** Two labels are present at the top:
* **D₅** (Left column)
* **D₈** (Right column)
* **Data Series:** Each column contains an identical, vertically aligned list of numbers.
* **Color Legend:** To the immediate left of each number is a small, solid-colored square. The color of these squares changes progressively down the list, forming a gradient scale.
### Detailed Analysis
The chart presents two identical data series under the headers `D₅` and `D₈`. Each series is a list of numbers that are powers of two, increasing from top to bottom.
**Data Points and Associated Colors (for both D₅ and D₈):**
The following table reconstructs the data. The color description is an approximation based on visual inspection, representing a gradient from light to dark.
| Position (Top to Bottom) | Numerical Value | Approximate Color Description |
| :--- | :--- | :--- |
| 1 | 8 | Very light gray |
| 2 | 16 | Light gray |
| 3 | 32 | Medium-light gray |
| 4 | 64 | Medium gray |
| 5 | 128 | Medium-dark gray/taupe |
| 6 | 256 | Dark gray/brown |
| 7 | 512 | Dark purple-brown |
| 8 | 1024 | Deep purple |
| 9 | 2048 | Very deep, saturated purple |
**Trend Verification:**
* **Numerical Trend:** Both columns show a clear, consistent exponential increase. Each subsequent number is double the previous one (8 → 16 → 32... → 2048).
* **Color Trend:** The associated color squares follow a corresponding gradient trend. The color starts as a very light, desaturated gray and progressively becomes darker, more saturated, and shifts in hue towards a deep purple as the numerical value increases. This creates a direct visual correlation between value magnitude and color intensity/darkness.
### Key Observations
1. **Identical Columns:** The data under `D₅` and `D₈` is exactly the same in both value and color progression. This suggests they may represent two different instances, trials, or categories that share an identical scale.
2. **Power-of-Two Sequence:** The numbers are not arbitrary; they form a strict base-2 logarithmic sequence (2³ to 2¹¹).
3. **Color as a Data Channel:** The primary information is conveyed through the pairing of number and color. The color is not decorative but is a direct visual encoding of the numerical value.
4. **Spatial Layout:** The legend (color squares) is positioned to the left of each data point (numbers). The entire chart is compact with no extraneous elements.
### Interpretation
This image is almost certainly a **color scale legend or key** for a data visualization, most likely a heatmap or a similar plot where color intensity represents a numerical magnitude.
* **What it demonstrates:** It defines how specific numerical values (from 8 to 2048) should be represented visually using a color gradient. The use of a power-of-two scale is common in computing and data science for representing memory, resolution, or other exponentially distributed data.
* **Relationship between elements:** The `D₅` and `D₈` labels likely refer to two different datasets, dimensions, or parameters (e.g., "Dimension 5" and "Dimension 8") that are both visualized using this same color mapping. The chart ensures consistency in how values are interpreted across these different contexts.
* **Purpose:** Its function is to allow a viewer to look at a colored cell in a heatmap or plot and estimate its underlying numerical value by matching the color to this key. The clear gradient from light to dark provides an intuitive mapping: lighter colors equal lower values, darker colors equal higher values.
* **Notable Anomaly:** The lack of any title, axis labels, or explanatory text indicates this is a supporting component meant to be embedded within a larger document or visualization where that context is already provided. Standing alone, it is purely a reference tool.