## Pie Chart: How accurate is the description of GPT4?
### Overview
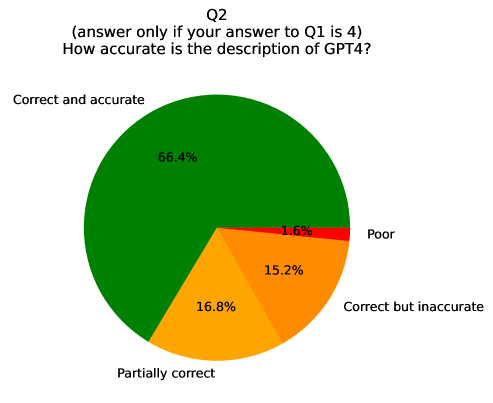
The chart visualizes responses to a survey question about the accuracy of GPT4's description. It is conditional on the respondent having answered "4" to a prior question (Q1). The data is divided into four categories, with percentages indicating distribution across response options.
### Components/Axes
- **Legend**: Positioned on the right side of the chart.
- **Green**: "Correct and accurate" (66.4%)
- **Yellow**: "Partially correct" (16.8%)
- **Orange**: "Correct but inaccurate" (15.2%)
- **Red**: "Poor" (1.6%)
- **Title**: "Q2 (answer only if your answer to Q1 is 4) How accurate is the description of GPT4?"
- **Data Segments**: Four proportional slices representing response categories.
### Detailed Analysis
1. **Correct and accurate** (Green, 66.4%):
- Largest segment, occupying ~2/3 of the chart.
- Positioned at the top-left quadrant.
2. **Partially correct** (Yellow, 16.8%):
- Second-largest segment, adjacent to the green slice.
3. **Correct but inaccurate** (Orange, 15.2%):
- Third-largest segment, adjacent to the yellow slice.
4. **Poor** (Red, 1.6%):
- Smallest segment, occupying ~1.6% of the chart.
- Positioned at the bottom-right edge.
### Key Observations
- **Dominance of "Correct and accurate"**: Over two-thirds of respondents rated GPT4's description as fully accurate.
- **Minority "Poor" responses**: Only 1.6% found the description unsatisfactory.
- **Middle-ground responses**: 32% (16.8% + 15.2%) indicated partial or mixed accuracy.
- **Color coding**: Green (positive), red (negative), yellow/orange (neutral/mixed).
### Interpretation
The data suggests strong consensus that GPT4's description is largely accurate, with a significant majority (66.4%) endorsing this view. The small red segment ("Poor") indicates minimal dissatisfaction, while the yellow and orange slices highlight nuanced feedback. The conditional nature of the question (dependent on Q1's answer being "4") implies this data reflects a subset of respondents with prior alignment on a related topic. The chart underscores GPT4's perceived reliability in this context, though the 32% middle-ground responses suggest room for improvement in clarity or completeness.