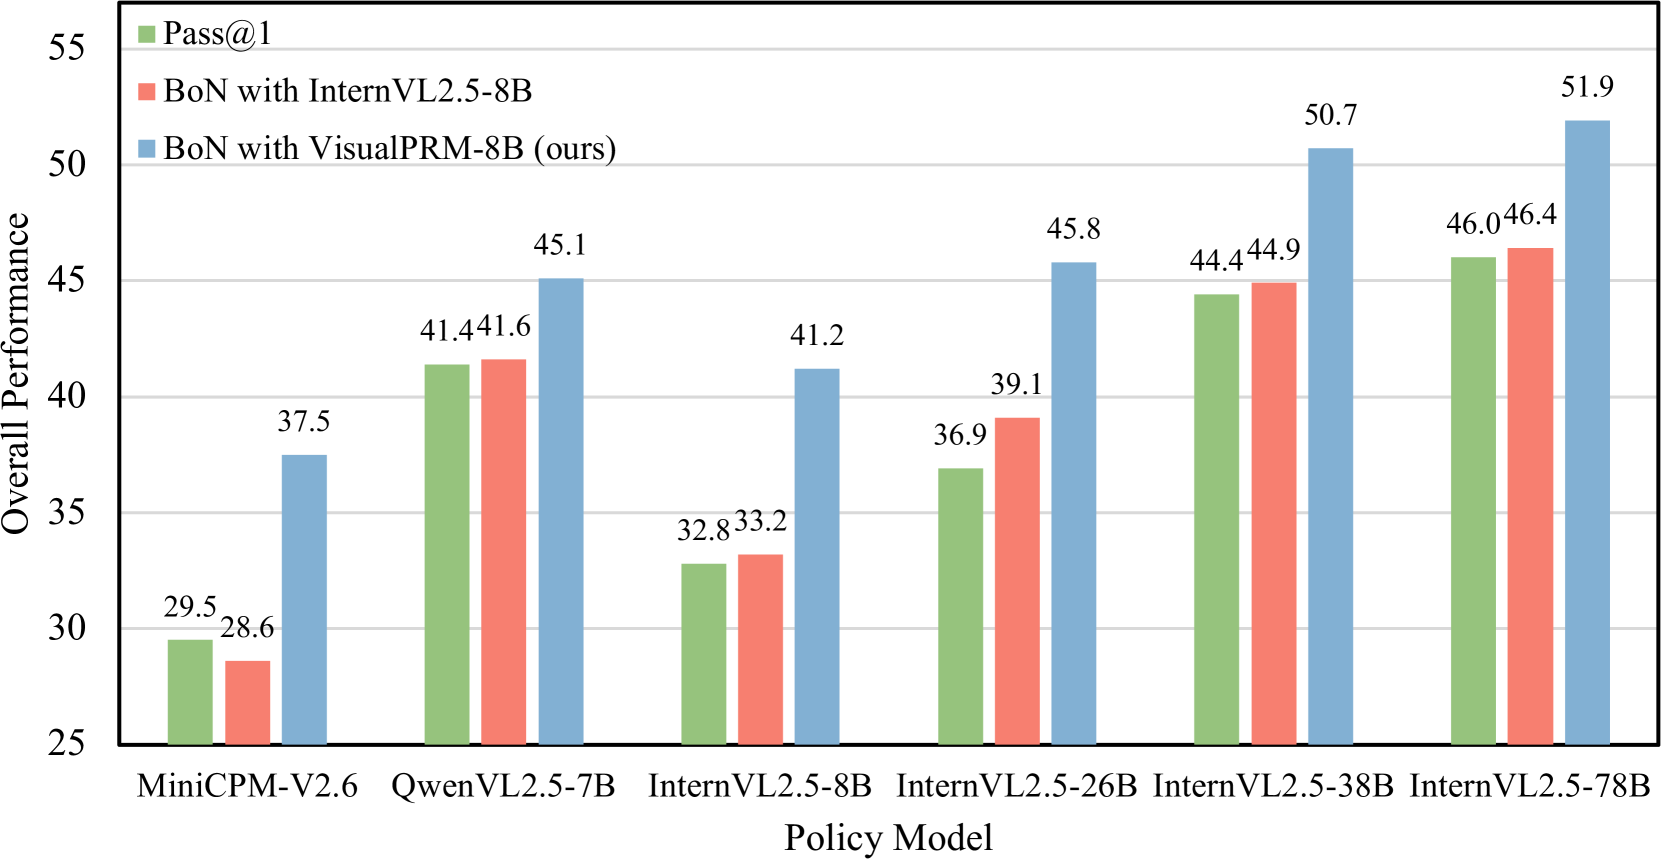
## Bar Chart: Overall Performance Comparison Across Policy Models
### Overview
The chart compares the overall performance of three policy models (Pass@1, BoN with InternVL2.5-8B, and BoN with VisualPRM-8B) across six different policy architectures (MiniCPM-V2.6, GwenVL2.5-7B, InternVL2.5-8B, InternVL2.5-26B, InternVL2.5-38B, InternVL2.5-78B). Performance is measured on a scale from 25 to 55.
### Components/Axes
- **X-axis (Policy Model)**:
- MiniCPM-V2.6
- GwenVL2.5-7B
- InternVL2.5-8B
- InternVL2.5-26B
- InternVL2.5-38B
- InternVL2.5-78B
- **Y-axis (Overall Performance)**:
- Scale from 25 to 55 in increments of 5.
- **Legend**:
- Green: Pass@1
- Red: BoN with InternVL2.5-8B
- Blue: BoN with VisualPRM-8B (ours)
### Detailed Analysis
1. **MiniCPM-V2.6**:
- Pass@1: 29.5 (green)
- BoN with InternVL2.5-8B: 28.6 (red)
- BoN with VisualPRM-8B: 37.5 (blue)
2. **GwenVL2.5-7B**:
- Pass@1: 41.4 (green)
- BoN with InternVL2.5-8B: 41.6 (red)
- BoN with VisualPRM-8B: 45.1 (blue)
3. **InternVL2.5-8B**:
- Pass@1: 32.8 (green)
- BoN with InternVL2.5-8B: 33.2 (red)
- BoN with VisualPRM-8B: 41.2 (blue)
4. **InternVL2.5-26B**:
- Pass@1: 36.9 (green)
- BoN with InternVL2.5-8B: 39.1 (red)
- BoN with VisualPRM-8B: 45.8 (blue)
5. **InternVL2.5-38B**:
- Pass@1: 44.4 (green)
- BoN with InternVL2.5-8B: 44.9 (red)
- BoN with VisualPRM-8B: 50.7 (blue)
6. **InternVL2.5-78B**:
- Pass@1: 46.0 (green)
- BoN with InternVL2.5-8B: 46.4 (red)
- BoN with VisualPRM-8B: 51.9 (blue)
### Key Observations
- **Trend Verification**:
- **Pass@1 (green)**: Gradually increases from 29.5 (MiniCPM-V2.6) to 46.0 (InternVL2.5-78B), showing consistent improvement as policy models scale.
- **BoN with InternVL2.5-8B (red)**: Starts at 28.6 (MiniCPM-V2.6) and rises to 46.4 (InternVL2.5-78B), mirroring the Pass@1 trend but with slightly lower values.
- **BoN with VisualPRM-8B (blue)**: Outperforms both metrics across all models, starting at 37.5 (MiniCPM-V2.6) and peaking at 51.9 (InternVL2.5-78B). The gap widens significantly for larger models (e.g., InternVL2.5-78B: 51.9 vs. 46.4 for BoN with InternVL2.5-8B).
- **Notable Outliers**:
- MiniCPM-V2.6 has the lowest performance for all metrics, with BoN with VisualPRM-8B showing the largest relative improvement (37.5 vs. 29.5 for Pass@1).
- InternVL2.5-78B achieves the highest performance for BoN with VisualPRM-8B (51.9), surpassing all other models.
### Interpretation
The data demonstrates that **BoN with VisualPRM-8B** consistently outperforms the other two policy models across all architectures, with the largest performance gains observed in larger models (InternVL2.5-38B and InternVL2.5-78B). This suggests that the VisualPRM-8B framework enhances the BoN (Bootstrapped Neural) approach more effectively than the InternVL2.5-8B variant, particularly as model complexity increases. The Pass@1 metric shows steady improvement but remains the weakest performer, indicating potential limitations in its design or training data. The results highlight the importance of architectural choices in policy models for achieving high overall performance.