\n
## Grouped Bar Chart: Overall Performance of Policy Models with Different Evaluation Methods
### Overview
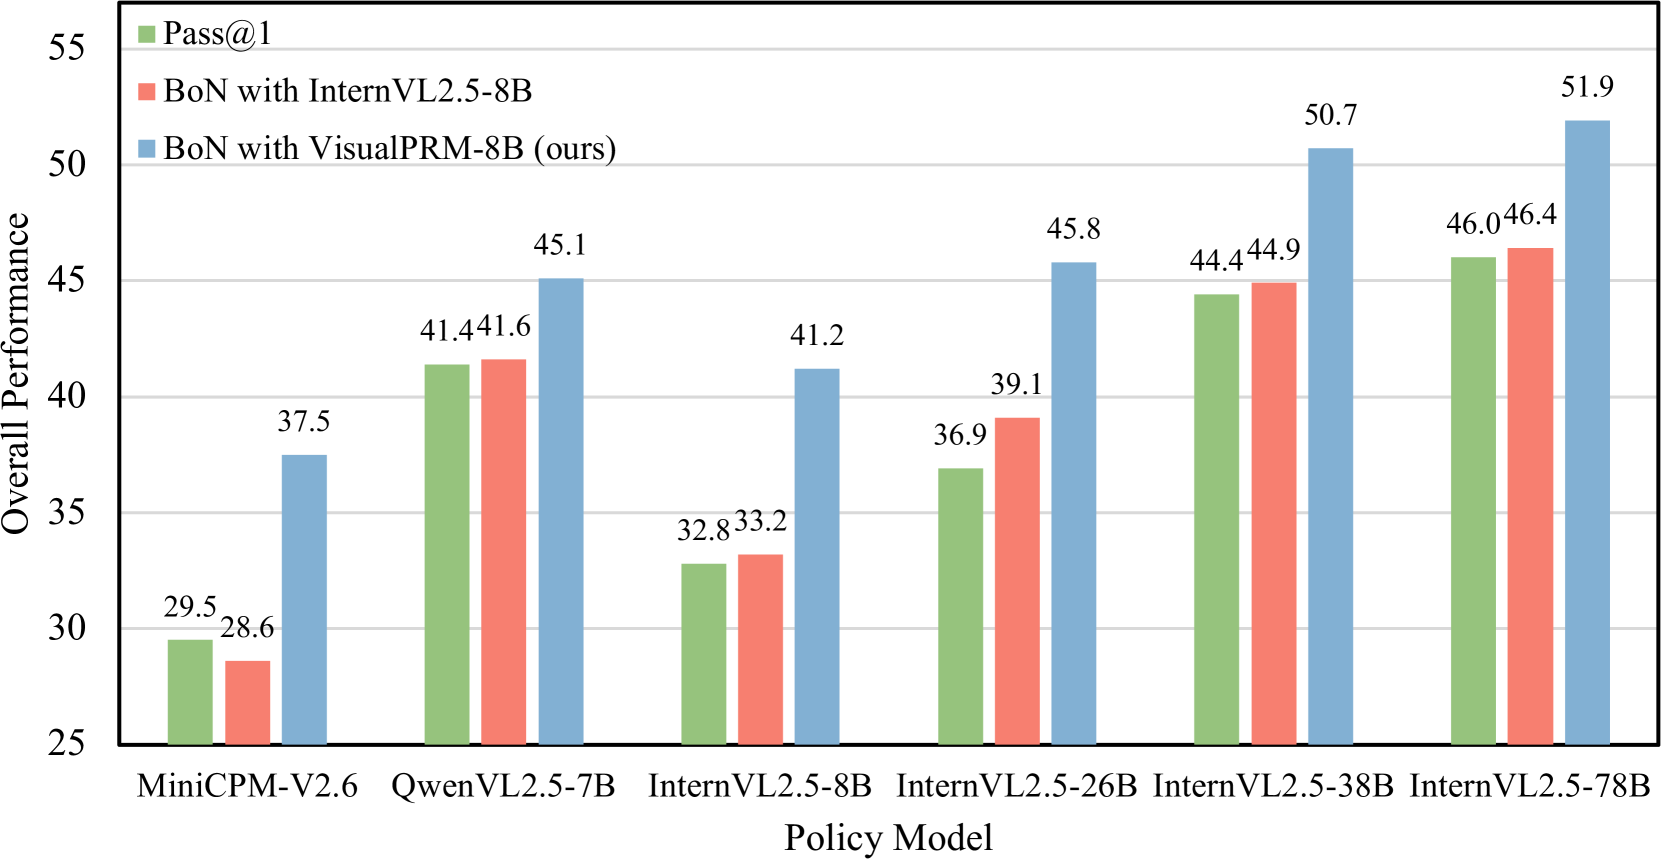
This image is a grouped bar chart comparing the "Overall Performance" of six different vision-language policy models. Each model is evaluated using three distinct methods, represented by differently colored bars. The chart demonstrates the performance impact of using different reward models within a "Best-of-N" (BoN) sampling strategy compared to a baseline.
### Components/Axes
* **Y-Axis:** Labeled "Overall Performance". The scale ranges from 25 to 55, with major gridlines at intervals of 5 (25, 30, 35, 40, 45, 50, 55).
* **X-Axis:** Labeled "Policy Model". It lists six specific models:
1. MiniCPM-V2.6
2. QwenVL2.5-7B
3. InternVL2.5-8B
4. InternVL2.5-26B
5. InternVL2.5-38B
6. InternVL2.5-78B
* **Legend:** Positioned in the top-left corner of the chart area. It defines three data series:
* **Green Square:** `Pass@1`
* **Red Square:** `BoN with InternVL2.5-8B`
* **Blue Square:** `BoN with VisualPRM-8B (ours)`
* **Data Labels:** Each bar has its exact numerical value displayed directly above it.
### Detailed Analysis
The chart presents performance data for each policy model across the three evaluation methods. The values are as follows:
**1. MiniCPM-V2.6**
* Pass@1 (Green): 29.5
* BoN with InternVL2.5-8B (Red): 28.6
* BoN with VisualPRM-8B (Blue): 37.5
**2. QwenVL2.5-7B**
* Pass@1 (Green): 41.4
* BoN with InternVL2.5-8B (Red): 41.6
* BoN with VisualPRM-8B (Blue): 45.1
**3. InternVL2.5-8B**
* Pass@1 (Green): 32.8
* BoN with InternVL2.5-8B (Red): 33.2
* BoN with VisualPRM-8B (Blue): 41.2
**4. InternVL2.5-26B**
* Pass@1 (Green): 36.9
* BoN with InternVL2.5-8B (Red): 39.1
* BoN with VisualPRM-8B (Blue): 45.8
**5. InternVL2.5-38B**
* Pass@1 (Green): 44.4
* BoN with InternVL2.5-8B (Red): 44.9
* BoN with VisualPRM-8B (Blue): 50.7
**6. InternVL2.5-78B**
* Pass@1 (Green): 46.0
* BoN with InternVL2.5-8B (Red): 46.4
* BoN with VisualPRM-8B (Blue): 51.9
### Key Observations
1. **Consistent Superiority of VisualPRM-8B:** For every single policy model, the blue bar (`BoN with VisualPRM-8B (ours)`) is the tallest, indicating it yields the highest overall performance.
2. **Performance Hierarchy:** The general trend across all models is: `BoN with VisualPRM-8B` > `BoN with InternVL2.5-8B` ≈ `Pass@1`. The red and green bars are often very close in height.
3. **Scale of Improvement:** The performance gain from using VisualPRM-8B (blue) over the other methods is substantial, ranging from approximately +3.5 points (QwenVL2.5-7B) to +8.4 points (InternVL2.5-8B).
4. **Model Scaling Trend:** Within the InternVL2.5 model family, performance generally increases with model size (from 8B to 78B parameters) for all three evaluation methods.
5. **Outlier - MiniCPM-V2.6:** This model shows a unique pattern where `Pass@1` (29.5) slightly outperforms `BoN with InternVL2.5-8B` (28.6), which is the opposite of the trend seen in all other models.
### Interpretation
This chart is likely from a research paper introducing "VisualPRM-8B" as a new process reward model. The data serves as empirical evidence for its effectiveness.
* **What the data suggests:** The primary finding is that using VisualPRM-8B as a reward model within a Best-of-N sampling framework (`BoN with VisualPRM-8B`) consistently and significantly boosts the overall performance of various vision-language policy models compared to both a standard Pass@1 evaluation and using a different reward model (InternVL2.5-8B).
* **Relationship between elements:** The chart directly compares the proposed method (blue) against two baselines (green and red). The consistent gap between the blue bars and the others across diverse policy models (different architectures and sizes) strengthens the claim that the improvement is attributable to the reward model itself, not a specific policy model.
* **Notable implications:** The results imply that the quality of the reward model is a critical factor for improving vision-language model performance via sampling-based methods. The fact that VisualPRM-8B outperforms the larger InternVL2.5-8B when used as a reward model suggests it may have been specifically optimized or trained for this reward modeling task, making it a more effective "judge" for selecting good responses. The scaling trend within InternVL2.5 also hints that larger policy models benefit similarly from better reward models.