## Chart Type: Multiple Line Graphs
### Overview
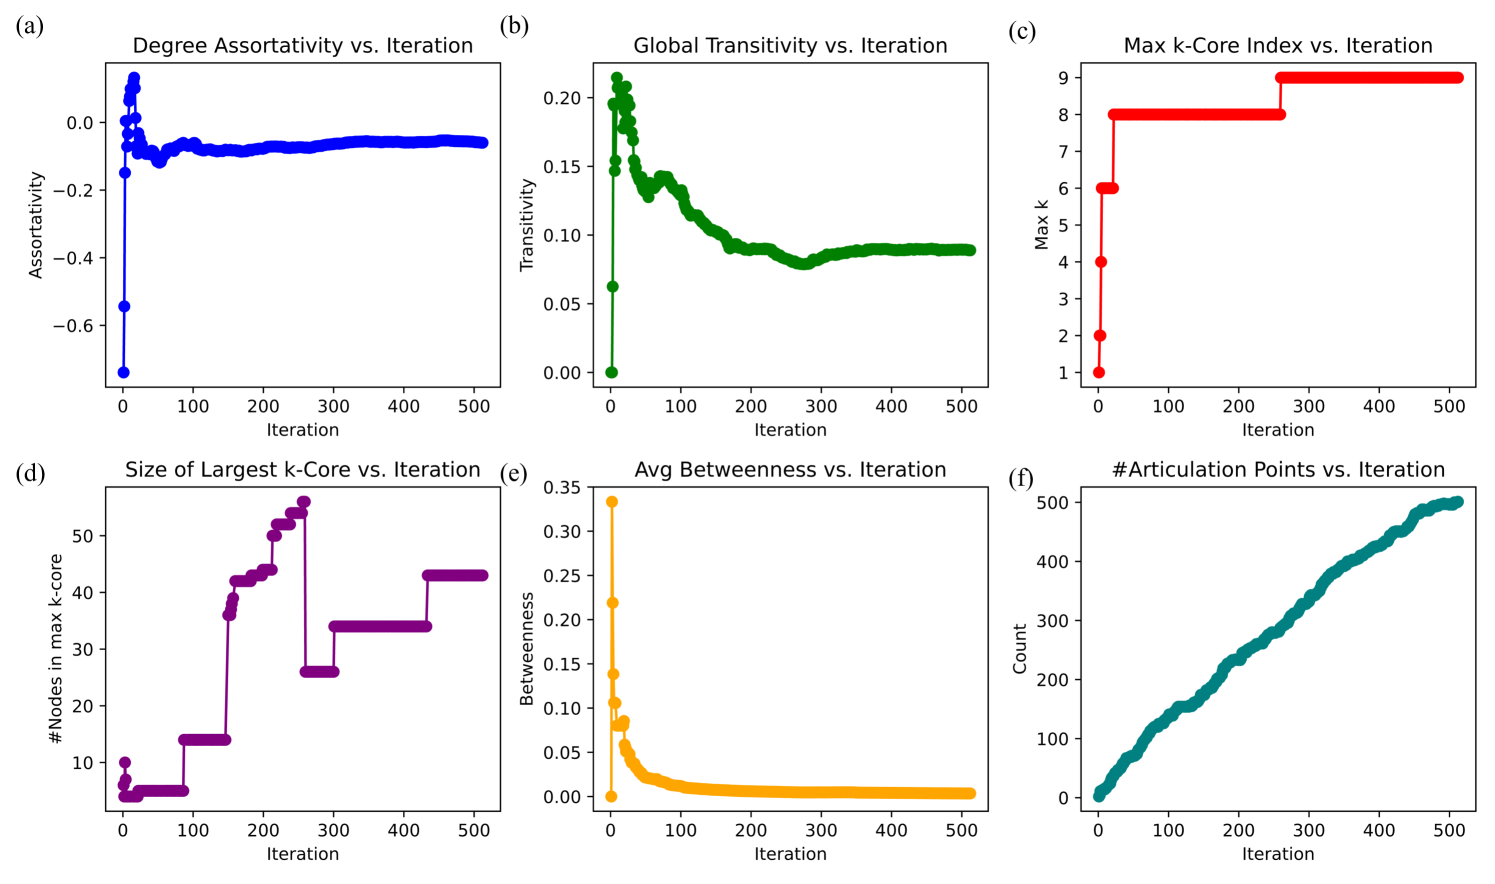
The image presents six line graphs arranged in a 2x3 grid, each plotting a different network metric against the iteration number. The metrics include Degree Assortativity, Global Transitivity, Max k-Core Index, Size of Largest k-Core, Avg Betweenness, and #Articulation Points. All graphs share a common x-axis labeled "Iteration" ranging from 0 to 500.
### Components/Axes
* **Overall Layout:** Six individual line graphs, labeled (a) through (f), arranged in two rows and three columns.
* **X-Axis (Common):** "Iteration", ranging from 0 to 500 in all six subplots.
* **(a) Degree Assortativity vs. Iteration:**
* Y-Axis: "Assortativity", ranging from -0.6 to 0.0.
* Data Series: Blue line.
* **(b) Global Transitivity vs. Iteration:**
* Y-Axis: "Transitivity", ranging from 0.00 to 0.20.
* Data Series: Green line.
* **(c) Max k-Core Index vs. Iteration:**
* Y-Axis: "Max k", ranging from 1 to 9.
* Data Series: Red line.
* **(d) Size of Largest k-Core vs. Iteration:**
* Y-Axis: "#Nodes in max k-core", ranging from 10 to 50.
* Data Series: Purple line.
* **(e) Avg Betweenness vs. Iteration:**
* Y-Axis: "Betweenness", ranging from 0.00 to 0.35.
* Data Series: Orange line.
* **(f) #Articulation Points vs. Iteration:**
* Y-Axis: "Count", ranging from 0 to 500.
* Data Series: Teal line.
### Detailed Analysis
* **(a) Degree Assortativity vs. Iteration (Blue Line):**
* Trend: Starts at approximately -0.7 at iteration 0, rapidly increases to around -0.1, and then stabilizes around -0.05 for the remaining iterations.
* Data Points:
* Iteration 0: -0.7
* Iteration 50: -0.1
* Iteration 500: -0.05
* **(b) Global Transitivity vs. Iteration (Green Line):**
* Trend: Starts high at approximately 0.20 at iteration 0, rapidly decreases to around 0.10, and then gradually decreases to approximately 0.09, where it stabilizes.
* Data Points:
* Iteration 0: 0.20
* Iteration 50: 0.14
* Iteration 250: 0.09
* Iteration 500: 0.09
* **(c) Max k-Core Index vs. Iteration (Red Line):**
* Trend: Starts at 1 at iteration 0, increases stepwise to 8 by iteration 50, remains at 8 until iteration 300, and then increases to 9, where it remains stable.
* Data Points:
* Iteration 0: 1
* Iteration 50: 8
* Iteration 300: 8
* Iteration 350: 9
* Iteration 500: 9
* **(d) Size of Largest k-Core vs. Iteration (Purple Line):**
* Trend: Starts low, increases in steps, plateaus, then increases again, and plateaus again.
* Data Points:
* Iteration 0: 5
* Iteration 100: 15
* Iteration 200: 40
* Iteration 250: 52
* Iteration 300: 26
* Iteration 400: 34
* Iteration 500: 44
* **(e) Avg Betweenness vs. Iteration (Orange Line):**
* Trend: Starts high at approximately 0.33 at iteration 0, rapidly decreases to near 0 by iteration 100, and remains close to 0 for the remaining iterations.
* Data Points:
* Iteration 0: 0.33
* Iteration 50: 0.02
* Iteration 500: 0.00
* **(f) #Articulation Points vs. Iteration (Teal Line):**
* Trend: Generally increases linearly from 0 to approximately 500 over the 500 iterations.
* Data Points:
* Iteration 0: 0
* Iteration 100: 100
* Iteration 200: 200
* Iteration 300: 300
* Iteration 400: 400
* Iteration 500: 500
### Key Observations
* Degree Assortativity stabilizes at a slightly negative value after an initial sharp increase.
* Global Transitivity decreases rapidly initially and then stabilizes at a low value.
* Max k-Core Index increases stepwise and plateaus at a maximum value of 9.
* Size of Largest k-Core increases in stages, showing periods of growth and stability.
* Avg Betweenness rapidly decreases to near zero.
* The number of Articulation Points increases almost linearly with the number of iterations.
### Interpretation
The graphs illustrate how various network properties change as the network evolves through iterations. The initial iterations seem to cause significant changes in assortativity, transitivity, betweenness, and k-core structure. The stabilization of assortativity and transitivity suggests that the network reaches a relatively stable configuration after the initial changes. The increasing k-core index and size indicate a strengthening of the network's core structure. The linear increase in articulation points suggests a continuous addition of critical nodes that connect different parts of the network. The rapid decrease in average betweenness implies that the network becomes more decentralized, with fewer nodes acting as critical intermediaries.