## Charts: Network Metrics vs. Iteration
### Overview
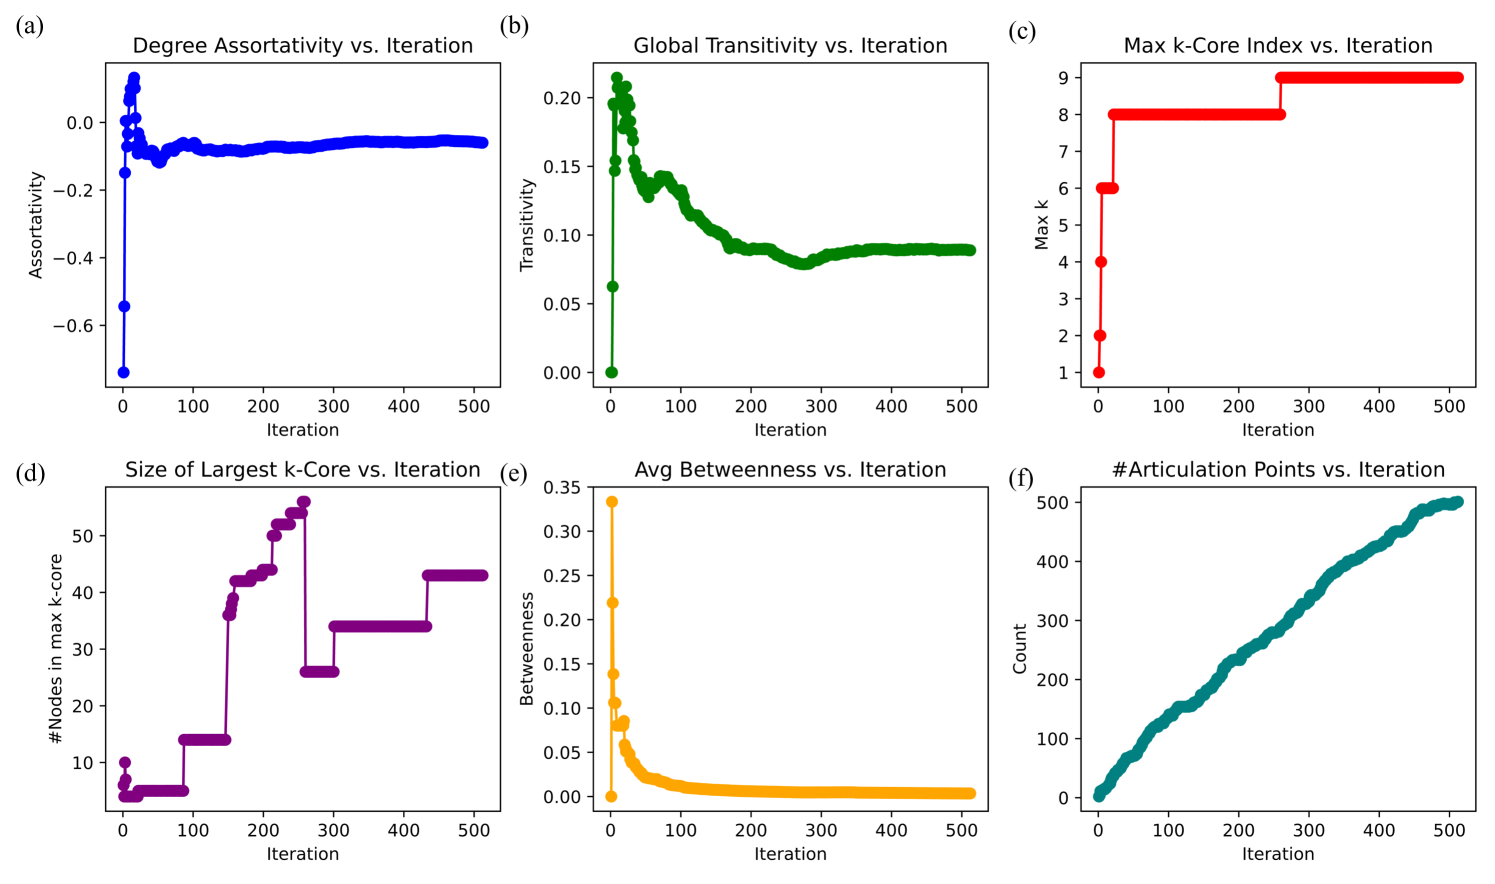
This image displays a 2x3 grid of six line/scatter plots, labeled (a) through (f). Each plot tracks a specific network topology metric on the y-axis against the number of iterations on the x-axis. The x-axis for all charts represents "Iteration" and ranges from 0 to slightly over 500. The charts illustrate the evolution of a network structure over time.
### Components/Axes
* **Common X-Axis:** "Iteration" (Range: 0 to 500+).
* **Grid Layout:**
* **(a) Top-Left:** Degree Assortativity vs. Iteration (Blue)
* **(b) Top-Center:** Global Transitivity vs. Iteration (Green)
* **(c) Top-Right:** Max k-Core Index vs. Iteration (Red)
* **(d) Bottom-Left:** Size of Largest k-Core vs. Iteration (Purple)
* **(e) Bottom-Center:** Avg Betweenness vs. Iteration (Orange)
* **(f) Bottom-Right:** #Articulation Points vs. Iteration (Teal)
---
### Detailed Analysis
#### (a) Degree Assortativity vs. Iteration (Blue)
* **Trend:** The plot begins with a sharp drop to approximately -0.75 at iteration 0, followed by a rapid spike to ~0.15 around iteration 20. It then exhibits damped oscillations, eventually stabilizing at a slightly negative value (approx. -0.05) from iteration 100 onwards.
* **Y-Axis:** "Assortativity" (Range: -0.6 to 0.1).
#### (b) Global Transitivity vs. Iteration (Green)
* **Trend:** Starts at 0, rises sharply to a peak of ~0.22 around iteration 10. It then undergoes a series of fluctuations, trending downward until it stabilizes around 0.09 from iteration 250 onwards.
* **Y-Axis:** "Transitivity" (Range: 0.00 to 0.20).
#### (c) Max k-Core Index vs. Iteration (Red)
* **Trend:** This is a step function. It starts at 1, jumps to 2, 4, 6, and 8 within the first 20 iterations. It remains constant at 8 for a significant duration (iterations 20 to ~260), then steps up to 9, where it remains until the end.
* **Y-Axis:** "Max k" (Range: 1 to 9).
#### (d) Size of Largest k-Core vs. Iteration (Purple)
* **Trend:** A complex step function. It starts low (approx. 5-10 nodes), stays flat, then exhibits several upward steps (reaching ~55 nodes around iteration 260). Notably, there is a sharp drop at iteration 260 down to ~26 nodes, followed by a recovery in steps to ~43 nodes by iteration 450.
* **Y-Axis:** "#Nodes in max k-core" (Range: 10 to 50).
#### (e) Avg Betweenness vs. Iteration (Orange)
* **Trend:** Starts at 0, spikes immediately to ~0.34 at iteration 5, then decays rapidly. By iteration 100, the value is near 0 and remains negligible for the rest of the iterations.
* **Y-Axis:** "Betweenness" (Range: 0.00 to 0.35).
#### (f) #Articulation Points vs. Iteration (Teal)
* **Trend:** A steady, nearly linear upward trend. It starts at 0 and increases consistently throughout the iterations, reaching a count of 500 by the end of the simulation.
* **Y-Axis:** "Count" (Range: 0 to 500).
---
### Key Observations
* **Structural Evolution:** The network undergoes significant structural changes in the first 100 iterations (as seen in the volatility of charts a, b, and e), followed by a period of relative stability or linear growth.
* **Step Functions:** Charts (c) and (d) demonstrate that the "k-core" structure of the network changes in discrete, sudden events rather than continuous growth.
* **Fragility:** The linear increase in "Articulation Points" (f) suggests that as the network grows, it is becoming increasingly fragile; the removal of a single node is increasingly likely to disconnect the graph.
* **Anomalies:** The sharp drop in the "Size of Largest k-Core" (d) at iteration 260 coincides with the jump in "Max k-Core Index" (c). This suggests a structural reorganization where the core became denser (higher k) but smaller in total node count.
### Interpretation
The data suggests a simulation of a growing network, likely following a preferential attachment or similar generative model.
* **Early Phase (0-100 iterations):** The network is highly dynamic. The spike in "Avg Betweenness" and "Transitivity" suggests the early formation of a dense, highly connected core or "hub" structure.
* **Late Phase (100-500 iterations):** The network enters a growth phase characterized by the addition of peripheral nodes. This is evidenced by the linear increase in "Articulation Points" (f) and the stabilization of "Assortativity" (a) and "Transitivity" (b).
* **The Iteration 260 Event:** This is the most critical point in the dataset. The simultaneous jump in the Max k-Core Index (c) and the drop in the Size of the Largest k-Core (d) indicates a "phase transition" or structural collapse/reorganization. The network likely consolidated its core, making it more robust (higher k-index) but shedding nodes that were previously part of that core, effectively pruning the network structure.