## Charts: Network Evolution Metrics vs. Iteration
### Overview
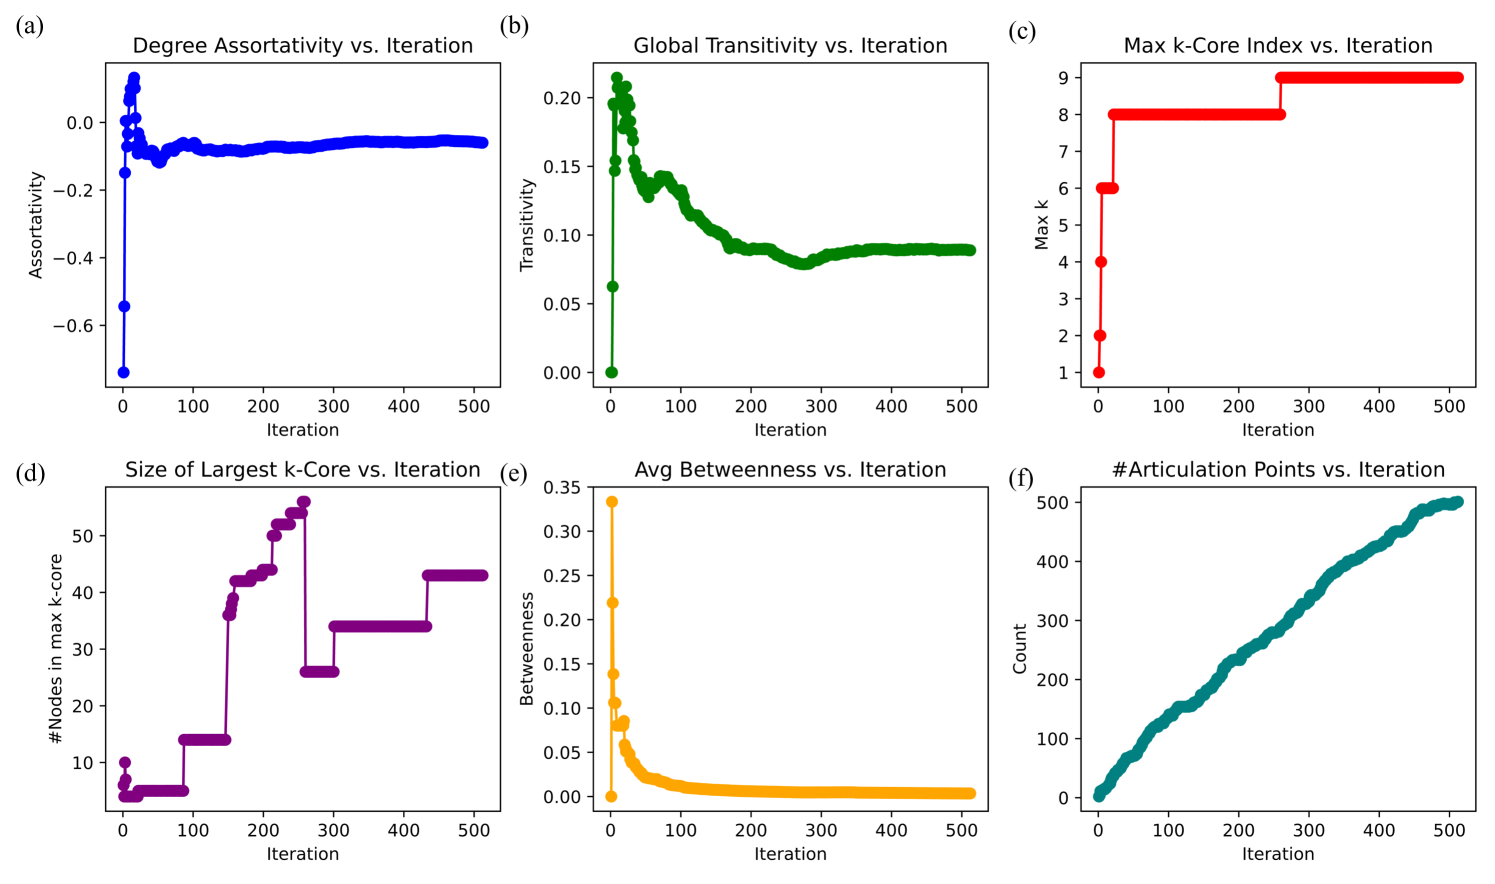
The image presents six separate line charts, each depicting the evolution of a different network metric as a function of iteration. The charts are arranged in a 2x3 grid. The metrics include Degree Assortativity, Global Transitivity, Max k-Core Index, Size of Largest k-Core, Average Betweenness Centrality, and the number of Articulation Points. All charts share a common x-axis representing "Iteration" ranging from 0 to 500.
### Components/Axes
All charts share the following:
* **X-axis:** "Iteration" (0 to 500)
* **Y-axis:** Varies depending on the chart (Assortativity, Transitivity, Max k, Nodes in max k-core, Betweenness, Count)
Each chart also has a title indicating the specific metric being plotted.
* **(a) Degree Assortativity vs. Iteration:** Y-axis: "Assortativity" (-0.6 to 0.2)
* **(b) Global Transitivity vs. Iteration:** Y-axis: "Transitivity" (0 to 0.2)
* **(c) Max k-Core Index vs. Iteration:** Y-axis: "Max k" (1 to 9)
* **(d) Size of Largest k-Core vs. Iteration:** Y-axis: "# Nodes in max k-core" (0 to 60)
* **(e) Avg Betweenness vs. Iteration:** Y-axis: "Betweenness" (0 to 0.35)
* **(f) #Articulation Points vs. Iteration:** Y-axis: "Count" (0 to 500)
Each chart contains a single line representing the metric's value over iterations.
### Detailed Analysis
**(a) Degree Assortativity vs. Iteration:**
The line (blue) starts at approximately 0.05 at iteration 0, dips to a minimum of approximately -0.55 at iteration 50, then rises to approximately 0.02 at iteration 500. The trend is initially decreasing, then increasing.
* Iteration 0: 0.05
* Iteration 50: -0.55
* Iteration 100: -0.45
* Iteration 200: -0.3
* Iteration 300: -0.1
* Iteration 400: 0.0
* Iteration 500: 0.02
**(b) Global Transitivity vs. Iteration:**
The line (green) starts at approximately 0.18 at iteration 0 and decreases steadily to approximately 0.02 at iteration 500. The trend is consistently downward.
* Iteration 0: 0.18
* Iteration 50: 0.14
* Iteration 100: 0.11
* Iteration 200: 0.08
* Iteration 300: 0.06
* Iteration 400: 0.04
* Iteration 500: 0.02
**(c) Max k-Core Index vs. Iteration:**
The line (red) remains relatively constant at approximately 8 for the first 300 iterations. It then increases to approximately 9 at iteration 400 and remains there until iteration 500. The trend is mostly flat, with a late increase.
* Iteration 0: 8.2
* Iteration 100: 8.1
* Iteration 200: 8.0
* Iteration 300: 8.0
* Iteration 400: 9.0
* Iteration 500: 9.0
**(d) Size of Largest k-Core vs. Iteration:**
The line (purple) starts at approximately 5 at iteration 0 and increases in a stepwise fashion, with plateaus. It reaches approximately 55 at iteration 500. The trend is generally upward, but with periods of stagnation.
* Iteration 0: 5
* Iteration 50: 15
* Iteration 100: 25
* Iteration 200: 35
* Iteration 300: 45
* Iteration 400: 50
* Iteration 500: 55
**(e) Avg Betweenness vs. Iteration:**
The line (orange) starts at approximately 0.02 at iteration 0 and increases steadily to approximately 0.3 at iteration 500. The trend is consistently upward.
* Iteration 0: 0.02
* Iteration 50: 0.08
* Iteration 100: 0.14
* Iteration 200: 0.20
* Iteration 300: 0.24
* Iteration 400: 0.27
* Iteration 500: 0.30
**(f) #Articulation Points vs. Iteration:**
The line (teal) starts at approximately 50 at iteration 0 and increases steadily to approximately 500 at iteration 500. The trend is consistently upward.
* Iteration 0: 50
* Iteration 50: 150
* Iteration 100: 250
* Iteration 200: 350
* Iteration 300: 400
* Iteration 400: 450
* Iteration 500: 500
### Key Observations
* Transitivity consistently decreases as iteration increases.
* Assortativity initially decreases, then increases, suggesting a change in network mixing patterns.
* The Max k-Core Index remains stable for a significant portion of the iterations before increasing.
* The Size of the Largest k-Core and the number of Articulation Points increase steadily throughout the iterations.
* Average Betweenness increases steadily throughout the iterations.
### Interpretation
The charts depict the evolution of a network undergoing some iterative process, likely a dynamic network construction or modification algorithm. The decreasing transitivity suggests the network is becoming less clustered as iterations progress. The initial decrease in assortativity, followed by an increase, indicates a shift in the network's degree distribution – initially becoming less likely to have connections between nodes of similar degree, then reverting. The increasing size of the largest k-core and the number of articulation points suggest the network is becoming more interconnected and robust, with more critical nodes. The increasing average betweenness centrality indicates that nodes are becoming more important in connecting different parts of the network. The stable Max k-Core index for the first 300 iterations suggests the core structure of the network is relatively stable before a late-stage increase in coreness. Overall, the data suggests a network evolving towards a more complex and interconnected structure, with increasing robustness and centrality.