TECHNICAL ASSET FINGERPRINT
9db5bea3f04939c1478eb572
Click to view fullscreen
Press ESC or click to close
FOUND IN PAPERS
EXPERT: healer-alpha-free VERSION 1
RUNTIME: free/openrouter/healer-alpha
INTEL_VERIFIED
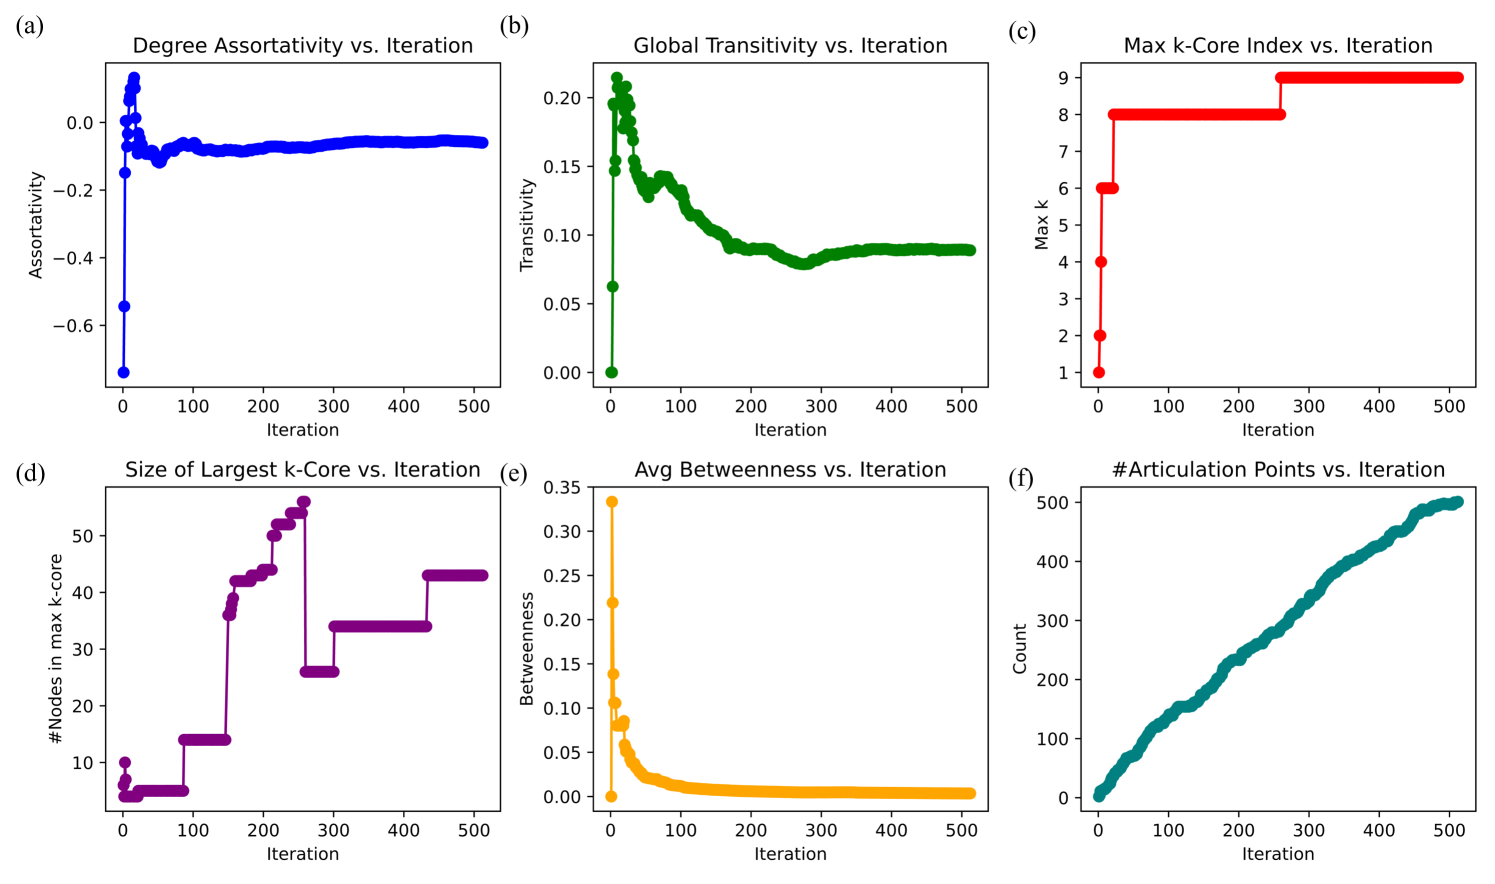
## Multi-Panel Figure: Network Metric Evolution Over Iterations
### Overview
The image is a composite figure containing six distinct subplots arranged in a 2x3 grid. Each subplot is a line or scatter plot tracking a different network metric against a common x-axis labeled "Iteration," ranging from 0 to 500. The figure appears to document the evolution of various topological properties of a network (likely a graph) during an iterative process, such as a simulation, optimization, or growth algorithm. The plots are labeled (a) through (f) in the top-left corner of each panel.
### Components/Axes
* **Layout:** 2 rows, 3 columns.
* **Common X-Axis:** All six plots share the same x-axis label: "Iteration". The axis is marked with major ticks at 0, 100, 200, 300, 400, and 500.
* **Individual Plot Titles & Y-Axes:**
* **(a) Top-Left:** Title: "Degree Assortativity vs. Iteration". Y-axis Label: "Assortativity". Y-axis scale: -0.6 to 0.0 (with ticks at -0.6, -0.4, -0.2, 0.0).
* **(b) Top-Center:** Title: "Global Transitivity vs. Iteration". Y-axis Label: "Transitivity". Y-axis scale: 0.00 to 0.20 (with ticks at 0.00, 0.05, 0.10, 0.15, 0.20).
* **(c) Top-Right:** Title: "Max k-Core Index vs. Iteration". Y-axis Label: "Max k". Y-axis scale: 1 to 9 (integer ticks).
* **(d) Bottom-Left:** Title: "Size of Largest k-Core vs. Iteration". Y-axis Label: "#Nodes in max k-core". Y-axis scale: 10 to 50 (with ticks at 10, 20, 30, 40, 50).
* **(e) Bottom-Center:** Title: "Avg Betweenness vs. Iteration". Y-axis Label: "Betweenness". Y-axis scale: 0.00 to 0.35 (with ticks at 0.00, 0.05, 0.10, 0.15, 0.20, 0.25, 0.30, 0.35).
* **(f) Bottom-Right:** Title: "#Articulation Points vs. Iteration". Y-axis Label: "Count". Y-axis scale: 0 to 500 (with ticks at 0, 100, 200, 300, 400, 500).
* **Data Series Colors:** Each plot uses a distinct color for its data points/line: (a) Blue, (b) Green, (c) Red, (d) Purple, (e) Orange, (f) Teal/Dark Cyan.
### Detailed Analysis
**Subplot (a): Degree Assortativity vs. Iteration (Blue)**
* **Trend:** The series begins with high volatility in the first ~50 iterations, then stabilizes into a near-constant, slightly negative value.
* **Data Points:** Starts at approximately -0.7 at iteration 0. Spikes sharply to a peak of ~0.1 at a very low iteration (<10). Fluctuates between -0.2 and 0.0 until iteration ~50. From iteration ~100 onward, it settles into a stable plateau at approximately -0.07 to -0.08, showing minimal variation through iteration 500.
**Subplot (b): Global Transitivity vs. Iteration (Green)**
* **Trend:** Shows a rapid initial increase to a peak, followed by a steady, decaying decline that eventually plateaus.
* **Data Points:** Starts at 0.0 at iteration 0. Peaks rapidly at approximately 0.21 within the first ~20 iterations. Enters a consistent downward trend, crossing 0.15 around iteration 50, 0.10 around iteration 150. The decline slows, reaching a minimum of ~0.08 around iteration 300. It then shows a very slight recovery and stabilizes at approximately 0.09 from iteration 400 to 500.
**Subplot (c): Max k-Core Index vs. Iteration (Red)**
* **Trend:** A step function that increases monotonically in discrete jumps, with long plateaus.
* **Data Points:** Starts at k=1. Jumps to k=2, then k=4, then k=6 in rapid succession within the first ~20 iterations. Plateaus at k=6 until approximately iteration 250. At iteration ~250, it jumps to k=8 and remains constant at k=8 until iteration 500.
**Subplot (d): Size of Largest k-Core vs. Iteration (Purple)**
* **Trend:** A complex, non-monotonic step function with periods of increase, sharp drops, and plateaus.
* **Data Points:** Starts at ~10 nodes. Drops to ~5 nodes and plateaus until iteration ~80. Jumps to ~15 nodes, plateaus until iteration ~150. Experiences a rapid, multi-step increase, peaking at approximately 55 nodes around iteration 250. Suffers a sharp drop to ~27 nodes, plateaus briefly. Jumps to ~35 nodes, plateaus until iteration ~450. Finally, jumps to ~43 nodes and plateaus through iteration 500.
**Subplot (e): Avg Betweenness vs. Iteration (Orange)**
* **Trend:** A sharp, exponential-like decay from a high initial value to a near-zero asymptote.
* **Data Points:** Starts at a very high value of ~0.34 at iteration 0. Plummets rapidly, falling below 0.10 by iteration ~20. The decay continues at a slower rate, reaching ~0.02 by iteration 100. From iteration 200 onward, the value is extremely close to zero (approximately 0.005 or less) and remains flat.
**Subplot (f): #Articulation Points vs. Iteration (Teal)**
* **Trend:** A steady, near-linear increase with minor fluctuations, showing no signs of plateauing.
* **Data Points:** Starts at 0 at iteration 0. Increases consistently, reaching ~100 by iteration 100, ~200 by iteration 200, ~300 by iteration 300, ~400 by iteration 400, and ~500 by iteration 500. The line is not perfectly smooth but has small, frequent variations around the linear trend.
### Key Observations
1. **Phase Transition:** Most metrics (a, b, c, d, e) exhibit a volatile or rapidly changing "transient phase" within the first 50-100 iterations, followed by a more stable "steady-state phase."
2. **Correlated Events:** The sharp drop in the size of the largest k-core (d) around iteration 250 coincides exactly with the jump in the max k-core index (c) from 6 to 8. This suggests a major structural reorganization of the network's core at that point.
3. **Divergent Behavior:** The number of articulation points (f) is the only metric that shows continuous, unbounded growth throughout the entire process, unlike the others which stabilize or fluctuate within bounds.
4. **Inverse Relationship:** The average betweenness (e) decays to near-zero as the number of articulation points (f) grows large. This makes intuitive sense, as a network with many articulation points (whose removal disconnects the graph) likely has a more fragmented, less centralized path structure.
### Interpretation
This figure collectively illustrates the topological evolution of a network undergoing an iterative process. The data suggests the process initially creates a dense, highly connected, and centralized structure (high transitivity, high betweenness, low articulation points). However, this structure is unstable.
A critical reorganization occurs around iteration 250, where the core becomes more exclusive (higher k) but smaller in size, while the network simultaneously becomes more fragmented (increasing articulation points). The end state (iteration 500) is a network with a small, tight-knit core (high k-core index), low global clustering (transitivity), minimal central brokerage (betweenness), and a high number of vulnerable connection points (articulation points). This profile is characteristic of a network that has evolved or been optimized for a specific, possibly modular or hierarchical, function at the expense of robustness and global connectivity. The steady rise in articulation points is a particularly strong indicator of increasing fragility or specialization in the network's architecture.
DECODING INTELLIGENCE...