## Line Graphs: Network Metrics vs. Iteration
### Overview
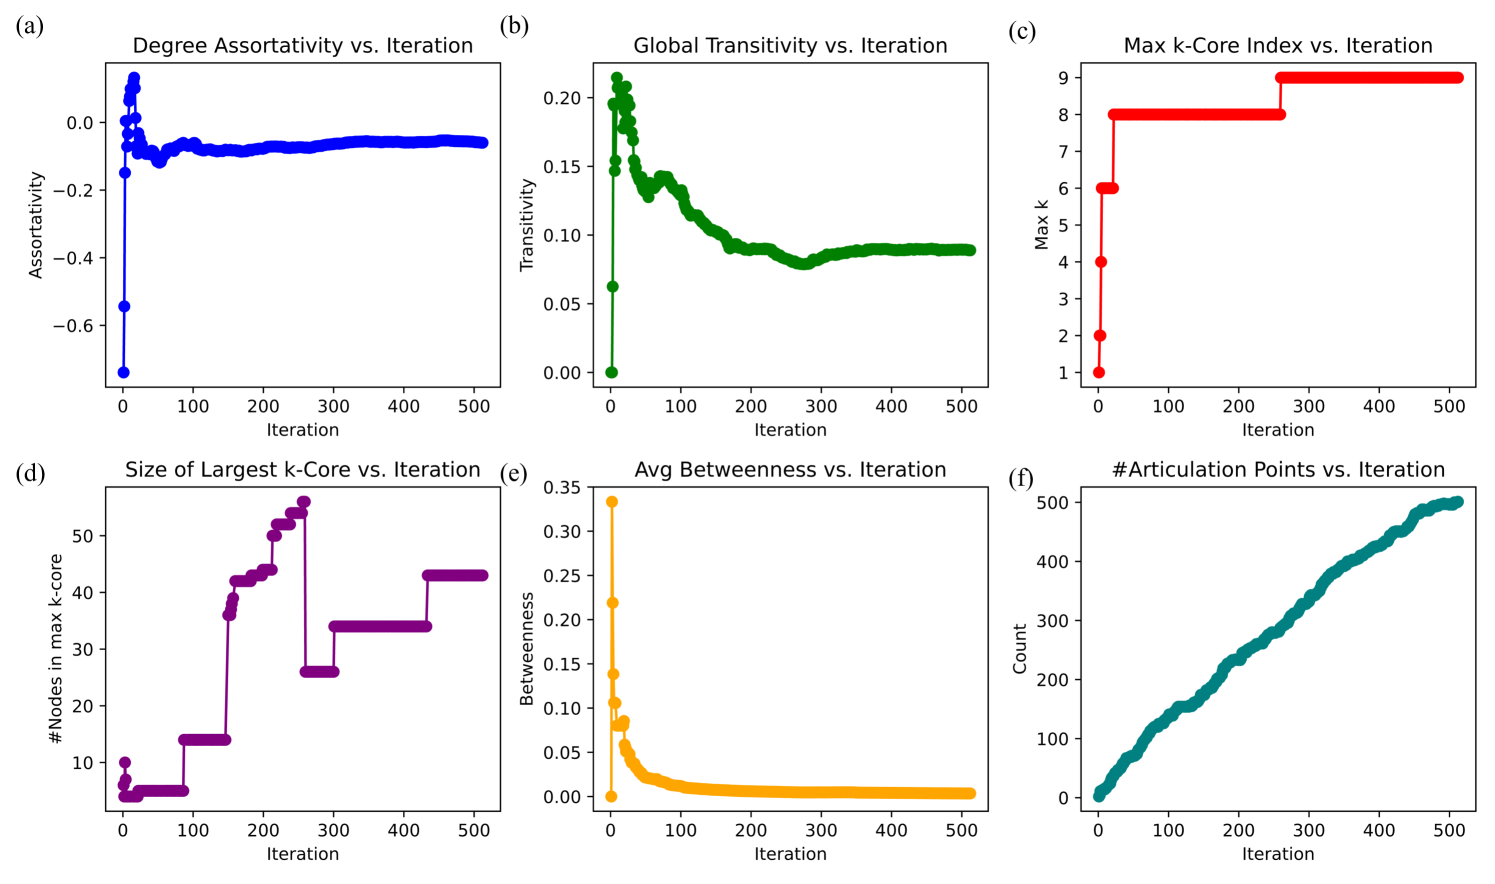
The image contains six subplots (a-f) arranged in a 2x3 grid, each visualizing a different network metric (degree assortativity, global transitivity, max k-core index, size of largest k-core, average betweenness, and articulation points) across 500 iterations. All plots use iteration count on the x-axis and metric-specific values on the y-axis. Data points are represented by colored markers connected by lines.
---
### Components/Axes
1. **Subplot (a): Degree Assortativity vs. Iteration**
- **Y-axis**: Assortativity (-0.6 to 0.0)
- **X-axis**: Iteration (0 to 500)
- **Color**: Blue
2. **Subplot (b): Global Transitivity vs. Iteration**
- **Y-axis**: Transitivity (0.0 to 0.2)
- **X-axis**: Iteration (0 to 500)
- **Color**: Green
3. **Subplot (c): Max k-Core Index vs. Iteration**
- **Y-axis**: Max k-Core Index (1 to 9)
- **X-axis**: Iteration (0 to 500)
- **Color**: Red
4. **Subplot (d): Size of Largest k-Core vs. Iteration**
- **Y-axis**: #Nodes in max k-core (0 to 50)
- **X-axis**: Iteration (0 to 500)
- **Color**: Purple
5. **Subplot (e): Avg Betweenness vs. Iteration**
- **Y-axis**: Betweenness (0.0 to 0.35)
- **X-axis**: Iteration (0 to 500)
- **Color**: Orange
6. **Subplot (f): #Articulation Points vs. Iteration**
- **Y-axis**: Count (0 to 500)
- **X-axis**: Iteration (0 to 500)
- **Color**: Teal
---
### Detailed Analysis
#### (a) Degree Assortativity vs. Iteration
- **Trend**: Sharp initial increase from -0.6 to -0.2 (iteration 0–50), followed by stabilization near 0.
- **Key Values**:
- Iteration 0: -0.6
- Iteration 50: -0.2
- Iteration 100–500: ~0.0
#### (b) Global Transitivity vs. Iteration
- **Trend**: Rapid decline from 0.2 to 0.05 (iteration 0–100), then plateau.
- **Key Values**:
- Iteration 0: 0.2
- Iteration 100: 0.05
- Iteration 200–500: ~0.05
#### (c) Max k-Core Index vs. Iteration
- **Trend**: Stepwise increases: 1 → 6 (iteration 0–50), 6 → 8 (iteration 50–150), 8 → 9 (iteration 150–250), then stable.
- **Key Values**:
- Iteration 0: 1
- Iteration 50: 6
- Iteration 150: 8
- Iteration 250: 9
#### (d) Size of Largest k-Core vs. Iteration
- **Trend**: Exponential growth with plateaus: 5 → 15 (iteration 0–50), 15 → 40 (iteration 50–150), 40 → 45 (iteration 150–250), then stable.
- **Key Values**:
- Iteration 0: 5
- Iteration 50: 15
- Iteration 150: 40
- Iteration 250: 45
#### (e) Avg Betweenness vs. Iteration
- **Trend**: Steep drop from 0.35 to near 0 (iteration 0–100), then flat.
- **Key Values**:
- Iteration 0: 0.35
- Iteration 50: 0.1
- Iteration 100: 0.02
- Iteration 200–500: ~0.0
#### (f) #Articulation Points vs. Iteration
- **Trend**: Linear increase from 0 to ~500 (iteration 0–500).
- **Key Values**:
- Iteration 0: 0
- Iteration 100: ~100
- Iteration 300: ~300
- Iteration 500: ~500
---
### Key Observations
1. **Initial Network Instability**: Metrics like assortativity and transitivity show abrupt changes in early iterations, suggesting rapid structural reorganization.
2. **Core Structure Emergence**: Max k-core index and largest k-core size plateau at high values, indicating stable core communities by iteration 250.
3. **Centrality Dynamics**: Betweenness centrality collapses early, while articulation points grow linearly, implying a shift from distributed to node-critical networks.
4. **Convergence**: Most metrics stabilize by iteration 250–500, except articulation points, which continue rising linearly.
---
### Interpretation
The data suggests a network evolving from a sparse, disconnected state to one with pronounced core structures and critical nodes. The early drop in betweenness centrality implies nodes lose their role as bridges, while rising articulation points highlight increasing reliance on specific nodes for connectivity. The stabilization of core metrics (k-core index, largest k-core size) indicates the formation of robust, hierarchical communities. These trends align with models of network growth where initial randomness gives way to structured, modular organization. The linear growth of articulation points may reflect a vulnerability to targeted attacks or failures in later stages.