## Object Detection Overlay: Aerial Bridge Scene
### Overview
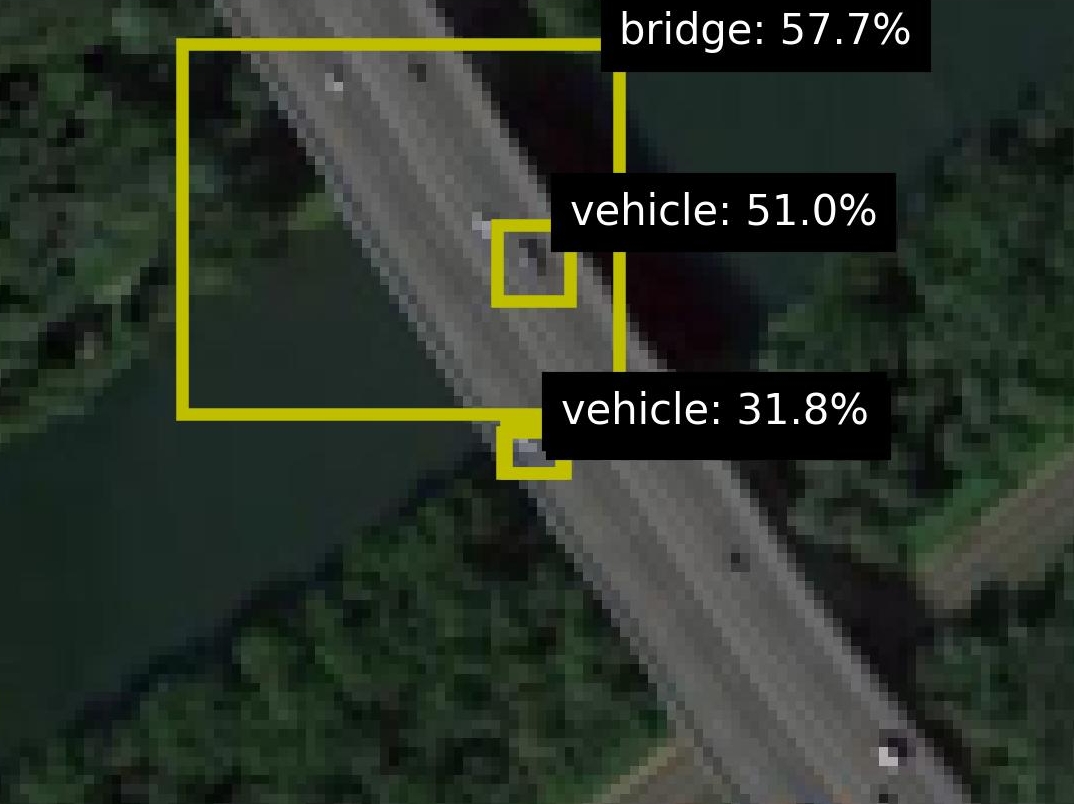
The image is a low-resolution aerial or satellite photograph, likely from a drone or overhead sensor, showing a bridge crossing a body of water. Overlaid on the photograph are the results of an object detection algorithm, presented as yellow bounding boxes with associated text labels and confidence scores. The scene is viewed from a high-angle, top-down perspective.
### Components/Axes
The image contains no traditional chart axes. The primary components are:
1. **Base Image:** A photographic scene.
2. **Detection Overlays:** Three yellow rectangular bounding boxes of varying sizes.
3. **Text Labels:** Black rectangular boxes with white text, positioned adjacent to their corresponding bounding boxes.
**Detected Objects and Labels:**
* **Object 1:** A large bounding box encompassing the main bridge structure.
* **Label:** `bridge: 57.7%`
* **Spatial Position:** The bounding box originates in the upper-left quadrant and extends diagonally towards the center-right. The label is positioned at the top-right corner of this box.
* **Object 2:** A small bounding box on the bridge deck.
* **Label:** `vehicle: 51.0%`
* **Spatial Position:** Located near the center of the image, slightly to the right. The label is positioned to the right of the box.
* **Object 3:** A small bounding box on the bridge deck, south of Object 2.
* **Label:** `vehicle: 31.8%`
* **Spatial Position:** Located in the lower-central part of the image. The label is positioned to the right of the box.
### Detailed Analysis
**Visual Scene Description:**
* **Bridge:** A grey, linear structure runs diagonally from the top-left to the bottom-right of the frame. It appears to be a multi-lane road bridge.
* **Water:** A dark, greenish body of water (likely a river or canal) flows beneath the bridge, visible on the left side and partially on the right.
* **Vegetation:** Dense, dark green foliage (trees and bushes) surrounds the water and the bridge approaches on both sides.
* **Image Quality:** The base photograph is pixelated and lacks fine detail, suggesting it is either a crop from a larger image or taken from a significant distance.
**Detection Data:**
The object detection system has identified three entities with the following confidence scores:
1. **Bridge:** Confidence = 57.7% (Moderate confidence)
2. **Vehicle (Upper):** Confidence = 51.0% (Moderate confidence)
3. **Vehicle (Lower):** Confidence = 31.8% (Low confidence)
### Key Observations
1. **Confidence Gradient:** There is a clear hierarchy in detection confidence. The largest object (the bridge) has the highest confidence, followed by one vehicle, with the second vehicle having notably lower confidence.
2. **Object Size vs. Confidence:** The two "vehicle" detections are of similar visual size in the image, yet their confidence scores differ significantly (51.0% vs. 31.8%). This suggests factors beyond simple size, such as contrast with the road surface, shape clarity, or contextual placement, influenced the model's certainty.
3. **Spatial Relationship:** The two vehicle detections are located on the bridge deck, consistent with the expected location for vehicles. The lower-confidence vehicle is positioned closer to the edge of the bridge structure.
4. **Bounding Box Precision:** The large "bridge" bounding box is not tightly fitted to the visible bridge structure; it includes a significant portion of the water and vegetation to the left. This may indicate the model's region proposal for the "bridge" class is broad or that the bridge's full extent is partially occluded or ambiguous in this view.
### Interpretation
This image represents the output of a computer vision model performing object detection on aerial imagery. The primary purpose is likely automated infrastructure monitoring or traffic analysis.
* **What the data suggests:** The model is moderately successful at identifying the primary infrastructure (the bridge) and is attempting to detect smaller objects (vehicles) upon it. The varying confidence scores indicate the model's uncertainty, which is crucial for downstream decision-making. A confidence of 31.8% for a vehicle is typically below standard deployment thresholds and would likely be filtered out in a practical system.
* **How elements relate:** The detections are contextually logical—vehicles are found on the bridge. The low resolution of the base image is a key limiting factor for detection accuracy, explaining the moderate-to-low confidence scores. The model is performing "detection," not "segmentation," as evidenced by the rectangular boxes rather than precise outlines.
* **Notable anomalies/outliers:** The most significant observation is the large discrepancy in confidence between the two visually similar vehicle detections. This warrants investigation: is the lower-confidence object actually a vehicle, or is it a different object (e.g., a road sign, a patch of discoloration) that the model misclassified? The imprecise bounding box for the bridge also suggests the model may struggle with defining the exact boundaries of large, linear infrastructure in overhead views.
* **Peircean Investigation:** The image is an *index* of an algorithmic process—it points directly to the operation of a detection model. The signs (the labels and boxes) are *icons* representing the model's hypothesized objects. The low confidence scores are *arguments* about the reliability of those hypotheses. To validate, one would need the original, high-resolution imagery and ground truth data. The image itself argues that automated analysis of such imagery is possible but fraught with uncertainty, requiring careful calibration and validation.