## Compound Image: Network Diagrams and Performance Charts
### Overview
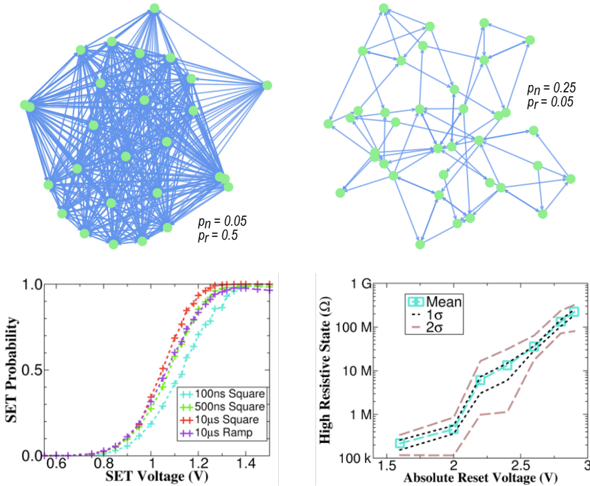
The image presents a compound figure comprising two network diagrams and two performance charts related to memristor behavior. The network diagrams illustrate connectivity patterns with different probabilities, while the charts depict SET probability versus SET voltage and high resistive state versus absolute reset voltage.
### Components/Axes
**Top-Left: Network Diagram 1**
* Nodes: Represented by green circles.
* Edges: Represented by blue lines connecting the nodes.
* Text: "p<sub>n</sub> = 0.05, p<sub>r</sub> = 0.5" located at the bottom-right of the diagram.
**Top-Right: Network Diagram 2**
* Nodes: Represented by green circles.
* Edges: Represented by blue lines with arrowheads, indicating directionality, connecting the nodes.
* Text: "p<sub>n</sub> = 0.25, p<sub>r</sub> = 0.05" located at the bottom-right of the diagram.
**Bottom-Left: SET Probability Chart**
* X-axis: "SET Voltage (V)", ranging from 0.6 to 1.4 in increments of 0.2.
* Y-axis: "SET Probability", ranging from 0.0 to 1.0 in increments of 0.5.
* Data Series:
* Cyan with '+': "100ns Square"
* Green with '+': "500ns Square"
* Red with '+': "10µs Square"
* Purple with '+': "10µs Ramp"
**Bottom-Right: High Resistive State Chart**
* X-axis: "Absolute Reset Voltage (V)", ranging from 1.5 to 3.0 in increments of 0.5.
* Y-axis: "High Resistive State (Ω)", logarithmic scale ranging from 100k to 1G.
* Data Series:
* Light Blue with Square Markers: "Mean"
* Black Dashed Line: "1σ"
* Brown Dashed Line: "2σ"
### Detailed Analysis
**Top-Left: Network Diagram 1**
* The diagram shows a network with a high degree of connectivity.
* The nodes are densely interconnected.
* p<sub>n</sub> = 0.05 and p<sub>r</sub> = 0.5.
**Top-Right: Network Diagram 2**
* The diagram shows a network with a lower degree of connectivity compared to the top-left diagram.
* The connections are directional, indicated by arrowheads.
* p<sub>n</sub> = 0.25 and p<sub>r</sub> = 0.05.
**Bottom-Left: SET Probability Chart**
* All data series show a sigmoidal trend, indicating a transition from low to high SET probability as the SET voltage increases.
* The "10µs Ramp" (purple) and "10µs Square" (red) curves are nearly overlapping and reach a SET probability of approximately 1.0 at a SET voltage of around 1.2V.
* The "500ns Square" (green) curve reaches a SET probability of approximately 1.0 at a SET voltage of around 1.3V.
* The "100ns Square" (cyan) curve reaches a SET probability of approximately 1.0 at a SET voltage of around 1.4V.
* At 0.8V, the 100ns Square has a probability of approximately 0.05.
* At 1.0V, the 100ns Square has a probability of approximately 0.3.
* At 1.2V, the 100ns Square has a probability of approximately 0.8.
**Bottom-Right: High Resistive State Chart**
* The "Mean" (light blue with square markers) shows an increasing trend of high resistive state with increasing absolute reset voltage.
* At 1.5V, the Mean is approximately 200kΩ.
* At 2.0V, the Mean is approximately 2MΩ.
* At 2.5V, the Mean is approximately 20MΩ.
* At 3.0V, the Mean is approximately 100MΩ.
* The "1σ" (black dashed line) and "2σ" (brown dashed line) represent the standard deviation bands around the mean. The spread increases with voltage.
### Key Observations
* The network diagrams show different connectivity patterns based on the probabilities p<sub>n</sub> and p<sub>r</sub>.
* The SET probability increases with SET voltage for all pulse types.
* The high resistive state increases with absolute reset voltage.
* The spread of the high resistive state, as indicated by the standard deviation bands, increases with voltage.
### Interpretation
The data suggests that the SET probability is highly dependent on the applied SET voltage and the pulse type. Longer pulse durations (10µs) result in a faster transition to a high SET probability compared to shorter pulse durations (100ns). The high resistive state of the memristor is also dependent on the absolute reset voltage, with higher voltages leading to higher resistance values. The increasing spread in the high resistive state at higher voltages indicates greater variability in the reset process. The network diagrams likely represent different configurations or states of the memristor network, with varying degrees of connectivity influencing the overall device behavior. The parameters p<sub>n</sub> and p<sub>r</sub> likely represent probabilities related to network connectivity or state transitions.