## Box Plot: Depthwise Average MIN-K% for Different Models
### Overview
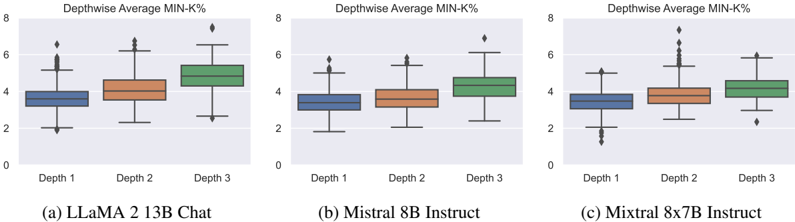
The image presents three box plots comparing the depthwise average MIN-K% for three different language models: LLaMA 2 13B Chat, Mistral 8B Instruct, and Mixtral 8x7B Instruct. Each box plot shows the distribution of MIN-K% values at three different depths (Depth 1, Depth 2, and Depth 3) within the model.
### Components/Axes
* **Title:** Depthwise Average MIN-K% (repeated above each subplot)
* **Y-axis:** Values range from 0 to 8, with tick marks at intervals of 2.
* **X-axis:** Represents the depth within the model, with categories "Depth 1", "Depth 2", and "Depth 3".
* **Box Plot Elements:** Each box plot displays the median (center line within the box), the interquartile range (IQR, represented by the box), the whiskers (lines extending from the box), and outliers (individual points beyond the whiskers).
* **Subplot Titles:**
* (a) LLaMA 2 13B Chat
* (b) Mistral 8B Instruct
* (c) Mixtral 8x7B Instruct
### Detailed Analysis
**Subplot (a): LLaMA 2 13B Chat**
* **Depth 1:** The box extends from approximately 3 to 4. The median is around 3.5. There are outliers above, reaching up to approximately 6.5.
* **Depth 2:** The box extends from approximately 3.5 to 4.5. The median is around 4. There are no visible outliers below, but there are outliers above, reaching up to approximately 7.
* **Depth 3:** The box extends from approximately 4.5 to 5.5. The median is around 5. There are outliers above, reaching up to approximately 8.
**Subplot (b): Mistral 8B Instruct**
* **Depth 1:** The box extends from approximately 3 to 4. The median is around 3.5. There are outliers above, reaching up to approximately 5.5.
* **Depth 2:** The box extends from approximately 3.5 to 4. The median is around 3.8. There are no visible outliers below, but there are outliers above, reaching up to approximately 7.5.
* **Depth 3:** The box extends from approximately 4 to 5. The median is around 4.5. There are outliers above, reaching up to approximately 6.
**Subplot (c): Mixtral 8x7B Instruct**
* **Depth 1:** The box extends from approximately 3 to 4. The median is around 3.5. There are outliers both above and below.
* **Depth 2:** The box extends from approximately 3.8 to 4.5. The median is around 4. There are outliers above, reaching up to approximately 7.5.
* **Depth 3:** The box extends from approximately 4 to 5. The median is around 4.5. There are outliers above, reaching up to approximately 8.
### Key Observations
* Across all three models, the median MIN-K% tends to increase slightly from Depth 1 to Depth 3.
* The range of MIN-K% values, as indicated by the box size, appears relatively consistent across the different depths for each model.
* Outliers are present in all box plots, indicating some variability in MIN-K% values at each depth.
* Mixtral 8x7B Instruct has more outliers at Depth 1 than the other models.
### Interpretation
The box plots provide a visual comparison of the depthwise average MIN-K% for the three language models. The MIN-K% metric likely represents some measure of information or activity within the model at different depths. The general trend of increasing median MIN-K% from Depth 1 to Depth 3 suggests that, on average, this metric tends to increase as information propagates through the model layers. The presence of outliers indicates that there are specific instances where the MIN-K% deviates significantly from the average at each depth. The differences in the distribution of MIN-K% values between the models may reflect differences in their architectures, training data, or overall performance characteristics.