## Box Plot: Depthwise Average MIN-K% Across Model Depths
### Overview
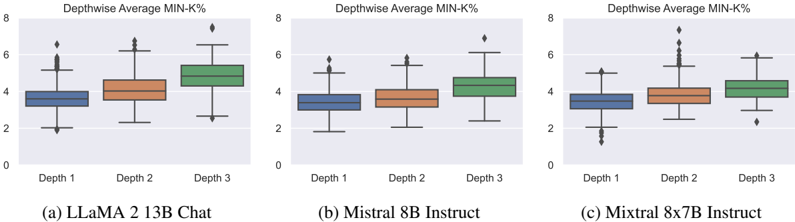
The image contains three side-by-side box plots comparing the depthwise average MIN-K% performance of three language models across three processing depths (Depth 1, Depth 2, Depth 3). Each subplot represents a different model architecture: (a) LLaMA 2 13B Chat, (b) Mistral 8B Instruct, and (c) Mixtral 8x7B Instruct. The y-axis measures MIN-K% (0-8 scale), while the x-axis categorizes data by processing depth.
### Components/Axes
- **X-axis**: Depth (1, 2, 3) - Categorical scale
- **Y-axis**: Depthwise Average MIN-K% (0-8) - Continuous scale
- **Legend**: Located at bottom-right corner, mapping colors to models:
- Blue: LLaMA 2 13B Chat
- Orange: Mistral 8B Instruct
- Green: Mixtral 8x7B Instruct
- **Subplot Titles**:
- (a) LLaMA 2 13B Chat
- (b) Mistral 8B Instruct
- (c) Mixtral 8x7B Instruct
### Detailed Analysis
1. **LLaMA 2 13B Chat (a)**:
- Depth 1: Median ~3.5, range 2-5, 1 outlier at 6.5
- Depth 2: Median ~4.2, range 3-5, 1 outlier at 6.2
- Depth 3: Median ~5.0, range 3-6, 2 outliers at 6.8 and 7.2
2. **Mistral 8B Instruct (b)**:
- Depth 1: Median ~3.8, range 2.5-5.2, 1 outlier at 5.8
- Depth 2: Median ~4.0, range 3-5.5, 1 outlier at 6.0
- Depth 3: Median ~4.5, range 3.5-6.2, 2 outliers at 6.5 and 7.0
3. **Mixtral 8x7B Instruct (c)**:
- Depth 1: Median ~3.2, range 2-4.5, 2 outliers at 1.8 and 5.0
- Depth 2: Median ~4.0, range 3-5.0, 1 outlier at 6.0
- Depth 3: Median ~4.8, range 3.5-6.5, 3 outliers at 5.5, 6.2, and 7.5
### Key Observations
- **Depth Correlation**: All models show increasing median MIN-K% values with greater depth (Depth 1 < Depth 2 < Depth 3)
- **Model Performance**: Mixtral 8x7B Instruct consistently shows highest median values across depths
- **Outlier Patterns**:
- LLaMA 2 has highest outlier values (up to 7.2)
- Mixtral 8x7B has most frequent outliers (3 instances)
- Mistral 8B shows moderate outlier distribution
- **Variance**: Depth 3 shows greatest interquartile range for all models
### Interpretation
The data suggests that deeper processing layers (Depth 3) generally yield better MIN-K% performance across all models, with Mixtral 8x7B Instruct demonstrating the strongest performance. The increasing median values with depth indicate potential architectural advantages in deeper processing layers. Outlier patterns suggest possible anomalies in specific configurations - notably LLaMA 2's high outliers might indicate exceptional cases in its processing pipeline. The consistent color coding (blue/orange/green) across subplots allows direct model comparison, with Mixtral's green boxes showing both highest medians and most variability. The 0.5-1.0 MIN-K% increase from Depth 1 to 3 across models suggests systematic improvements in deeper processing stages.