## Chart: Sensitivity to Top-K
### Overview
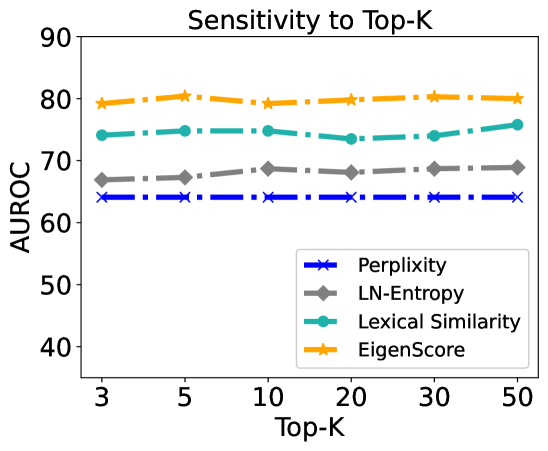
The image is a line chart showing the sensitivity of four different metrics (Perplexity, LN-Entropy, Lexical Similarity, and EigenScore) to the "Top-K" parameter. The y-axis represents AUROC (Area Under the Receiver Operating Characteristic curve), a measure of classification performance. The x-axis represents the Top-K value, which ranges from 3 to 50.
### Components/Axes
* **Title:** Sensitivity to Top-K
* **X-axis:** Top-K, with values 3, 5, 10, 20, 30, and 50.
* **Y-axis:** AUROC, ranging from 40 to 90.
* **Legend:** Located in the bottom-right of the chart.
* Blue with "x" markers: Perplexity
* Gray with diamond markers: LN-Entropy
* Teal with circle markers: Lexical Similarity
* Orange with star markers: EigenScore
### Detailed Analysis
* **Perplexity (Blue):** The line is relatively flat, with AUROC values consistently around 64-65.
* Top-K = 3: AUROC ≈ 64
* Top-K = 5: AUROC ≈ 64
* Top-K = 10: AUROC ≈ 64
* Top-K = 20: AUROC ≈ 64
* Top-K = 30: AUROC ≈ 64
* Top-K = 50: AUROC ≈ 64
* **LN-Entropy (Gray):** The line shows a slight upward trend, with AUROC values increasing from approximately 67 to 69.
* Top-K = 3: AUROC ≈ 67
* Top-K = 5: AUROC ≈ 67
* Top-K = 10: AUROC ≈ 68
* Top-K = 20: AUROC ≈ 68
* Top-K = 30: AUROC ≈ 69
* Top-K = 50: AUROC ≈ 69
* **Lexical Similarity (Teal):** The line is relatively flat, with a slight upward trend, with AUROC values ranging from approximately 74 to 76.
* Top-K = 3: AUROC ≈ 74
* Top-K = 5: AUROC ≈ 75
* Top-K = 10: AUROC ≈ 75
* Top-K = 20: AUROC ≈ 75
* Top-K = 30: AUROC ≈ 74
* Top-K = 50: AUROC ≈ 76
* **EigenScore (Orange):** The line is relatively flat, with AUROC values consistently around 79-80.
* Top-K = 3: AUROC ≈ 79
* Top-K = 5: AUROC ≈ 80
* Top-K = 10: AUROC ≈ 79
* Top-K = 20: AUROC ≈ 79
* Top-K = 30: AUROC ≈ 80
* Top-K = 50: AUROC ≈ 80
### Key Observations
* EigenScore consistently achieves the highest AUROC values across all Top-K values.
* Perplexity consistently achieves the lowest AUROC values across all Top-K values.
* LN-Entropy shows a slight improvement in AUROC as Top-K increases.
* Lexical Similarity shows a slight improvement in AUROC as Top-K increases.
* The sensitivity to Top-K is relatively low for all four metrics, as the AUROC values do not change drastically with varying Top-K values.
### Interpretation
The chart suggests that EigenScore is the most effective metric for the task being evaluated, as it consistently achieves the highest AUROC values. Perplexity, on the other hand, appears to be the least effective. The relatively flat lines for all metrics indicate that the performance is not highly sensitive to the Top-K parameter within the range of 3 to 50. This could mean that the task is relatively robust to the choice of Top-K, or that the optimal Top-K value lies outside this range. The slight upward trend for LN-Entropy and Lexical Similarity suggests that increasing Top-K may lead to marginal improvements in performance for these metrics.