## Line Chart: Sensitivity to Top-K
### Overview
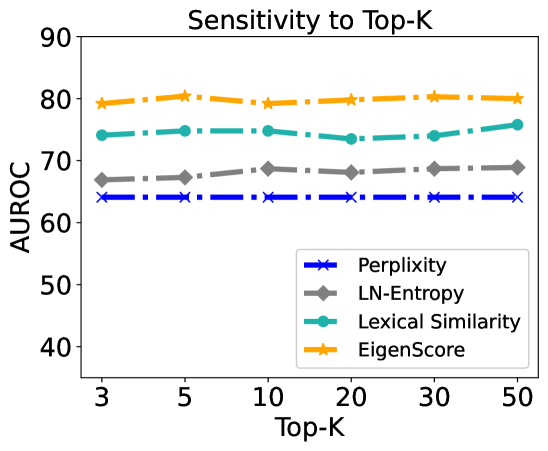
This image is a line chart titled "Sensitivity to Top-K" that evaluates the performance of four different metrics—Perplexity, LN-Entropy, Lexical Similarity, and EigenScore—using the AUROC (Area Under the Receiver Operating Characteristic curve) metric. The chart tests how these metrics respond to changes in the "Top-K" parameter, ranging from 3 to 50. The overall visual impression is one of high stability across all tested methods.
### Components/Axes
* **Title**: "Sensitivity to Top-K" (Centered at the top).
* **Y-Axis**:
* **Label**: "AUROC" (Vertical, left side).
* **Scale**: Numerical, ranging from 35 to 90. Major tick marks are visible at 40, 50, 60, 70, 80, and 90.
* **X-Axis**:
* **Label**: "Top-K" (Horizontal, bottom center).
* **Scale**: Categorical/Discrete values: 3, 5, 10, 20, 30, 50.
* **Legend**: Located in the **bottom-right** quadrant within a white box with a thin grey border. It contains four entries:
* **Blue line with 'x' markers**: Perplexity
* **Grey line with diamond (♦) markers**: LN-Entropy
* **Teal/Cyan line with circle (●) markers**: Lexical Similarity
* **Orange line with star (★) markers**: EigenScore
* **Line Style**: All data series use a dash-dot line pattern.
### Content Details
#### Data Table (Approximate Values)
The following table reconstructs the data points based on visual alignment with the Y-axis scale. Values are estimated with an uncertainty of approximately ±0.5 units.
| Top-K | Perplexity (Blue x) | LN-Entropy (Grey ♦) | Lexical Similarity (Teal ●) | EigenScore (Orange ★) |
| :--- | :---: | :---: | :---: | :---: |
| **3** | ~64.0 | ~67.0 | ~74.0 | ~79.0 |
| **5** | ~64.0 | ~67.5 | ~75.0 | ~80.5 |
| **10** | ~64.0 | ~68.5 | ~75.0 | ~79.0 |
| **20** | ~64.0 | ~68.0 | ~73.5 | ~80.0 |
| **30** | ~64.0 | ~68.5 | ~74.0 | ~80.5 |
| **50** | ~64.0 | ~69.0 | ~76.0 | ~80.0 |
#### Trend Verification
* **EigenScore (Orange)**: Positioned at the top of the chart. The line is relatively flat with minor fluctuations, maintaining a high AUROC around 80.
* **Lexical Similarity (Teal)**: Positioned second from the top. It shows slight volatility, with a small dip at K=20 and a peak at K=50, generally staying between 73 and 76.
* **LN-Entropy (Grey)**: Positioned third from the top. It exhibits a very slight upward trend as K increases, moving from ~67 to ~69.
* **Perplexity (Blue)**: Positioned at the bottom. The line is perfectly horizontal, indicating zero sensitivity to the Top-K parameter within this range.
### Key Observations
* **Performance Ranking**: There is a clear and consistent hierarchy across all values of K: EigenScore > Lexical Similarity > LN-Entropy > Perplexity.
* **Parameter Robustness**: All four methods demonstrate remarkable stability. The AUROC scores do not significantly degrade or improve as the Top-K value increases from 3 to 50.
* **Perplexity Invariance**: The Perplexity metric appears completely unaffected by the Top-K setting, suggesting its calculation might be independent of this specific parameter in the context of this experiment.
### Interpretation
The data suggests that the choice of the "Top-K" hyperparameter is not critical for the performance of these specific metrics in the evaluated task. This is a positive finding for practitioners, as it implies that the models are robust and do not require extensive hyperparameter tuning for the Top-K value to achieve optimal AUROC.
**EigenScore** is the superior metric among those tested, consistently outperforming the others by a significant margin (approximately 5 points higher than Lexical Similarity and 15 points higher than Perplexity). The stability of EigenScore at the ~80 AUROC level indicates it is a reliable and high-performing choice regardless of whether a narrow (K=3) or wide (K=50) context is considered. The slight upward trend in **LN-Entropy** suggests it might benefit marginally from larger K values, whereas **Lexical Similarity** shows more noise, possibly due to the inherent variability in lexical overlap as the sample size (K) changes.