## Line Chart: Sensitivity to Top-K
### Overview
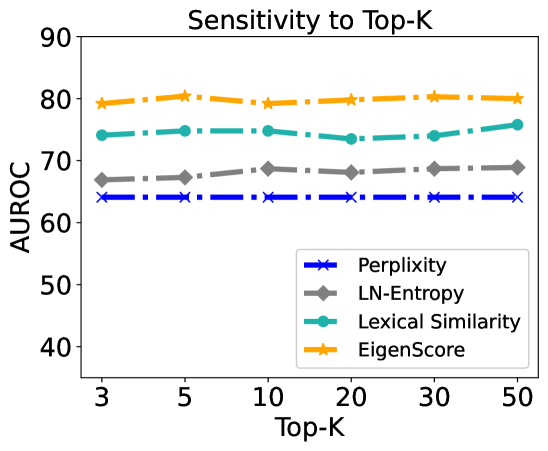
This is a line chart titled "Sensitivity to Top-K" that plots the performance of four different metrics (Perplexity, LN-Entropy, Lexical Similarity, and EigenScore) as a function of the "Top-K" parameter. The performance is measured by the AUROC (Area Under the Receiver Operating Characteristic Curve) score. The chart demonstrates how sensitive each metric's performance is to changes in the Top-K value.
### Components/Axes
* **Chart Title:** "Sensitivity to Top-K" (centered at the top).
* **Y-Axis:**
* **Label:** "AUROC"
* **Scale:** Linear, ranging from 40 to 90.
* **Major Ticks:** 40, 50, 60, 70, 80, 90.
* **X-Axis:**
* **Label:** "Top-K"
* **Scale:** Appears to be categorical or logarithmic, with discrete values.
* **Data Points (Ticks):** 3, 5, 10, 20, 30, 50.
* **Legend:** Located in the bottom-right corner of the plot area. It maps line colors and marker styles to metric names:
* **Blue line with 'x' markers:** Perplexity
* **Gray line with diamond markers:** LN-Entropy
* **Teal line with circle markers:** Lexical Similarity
* **Orange line with star markers:** EigenScore
### Detailed Analysis
The chart displays four data series, each showing a relatively flat trend across the range of Top-K values.
1. **EigenScore (Orange, Star Markers):**
* **Trend:** The line is nearly horizontal, showing a very slight upward trend from Top-K=3 to Top-K=50.
* **Approximate Values:**
* Top-K=3: ~79
* Top-K=5: ~80
* Top-K=10: ~79
* Top-K=20: ~80
* Top-K=30: ~80
* Top-K=50: ~80
2. **Lexical Similarity (Teal, Circle Markers):**
* **Trend:** The line is mostly flat with a minor dip around Top-K=20 before recovering.
* **Approximate Values:**
* Top-K=3: ~74
* Top-K=5: ~75
* Top-K=10: ~75
* Top-K=20: ~73
* Top-K=30: ~74
* Top-K=50: ~76
3. **LN-Entropy (Gray, Diamond Markers):**
* **Trend:** The line is very flat, showing minimal variation.
* **Approximate Values:**
* Top-K=3: ~67
* Top-K=5: ~67
* Top-K=10: ~68
* Top-K=20: ~68
* Top-K=30: ~68
* Top-K=50: ~68
4. **Perplexity (Blue, 'x' Markers):**
* **Trend:** The line is almost perfectly horizontal, indicating no sensitivity to Top-K.
* **Approximate Values:**
* Top-K=3: ~64
* Top-K=5: ~64
* Top-K=10: ~64
* Top-K=20: ~64
* Top-K=30: ~64
* Top-K=50: ~64
### Key Observations
* **Performance Hierarchy:** There is a clear and consistent performance ranking across all Top-K values: EigenScore > Lexical Similarity > LN-Entropy > Perplexity.
* **Low Sensitivity:** All four metrics exhibit very low sensitivity to the Top-K parameter within the tested range (3 to 50). The AUROC scores change by only 1-2 points at most.
* **Stability:** The Perplexity metric is the most stable, showing virtually no change. EigenScore and LN-Entropy are also highly stable. Lexical Similarity shows the most variation, though it is still minimal.
* **Visual Separation:** The lines for the four metrics are distinctly separated and do not intersect, confirming their consistent relative performance.
### Interpretation
The data suggests that for the task being evaluated, the choice of Top-K (within the range of 3 to 50) has a negligible impact on the performance of these four evaluation metrics. This is a significant finding, as it implies that model comparisons using these metrics would be robust to the specific choice of the Top-K hyperparameter.
The consistent performance hierarchy indicates that **EigenScore** is the most effective metric (highest AUROC) for this particular task, followed by **Lexical Similarity**. **Perplexity**, a common language model metric, performs the worst in this context. This could imply that the task requires evaluation criteria beyond simple next-token prediction likelihood, favoring metrics that capture semantic similarity (Lexical Similarity) or distributional properties (EigenScore, LN-Entropy).
The investigation reveals a stable evaluation landscape where the primary differentiator is the choice of metric itself, not the tuning of the Top-K parameter. This allows for more confident and less parameter-sensitive model selection and comparison.