## Line Chart: Sensitivity to Top-K
### Overview
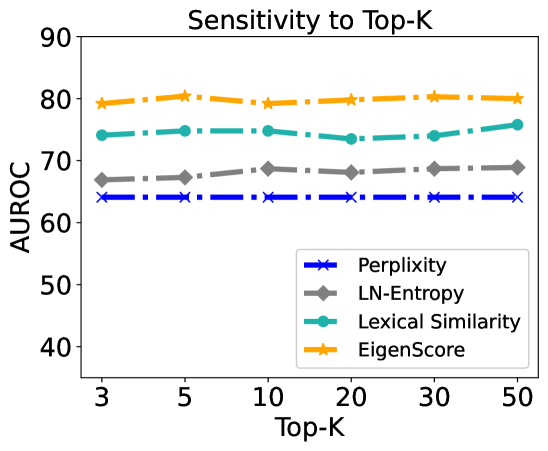
The chart illustrates the sensitivity of four evaluation metrics (Perplexity, LN-Entropy, Lexical Similarity, EigenScore) to varying Top-K values (3–50) using Area Under the Receiver Operating Characteristic curve (AUROC) as the performance metric. All metrics exhibit relatively stable performance across Top-K ranges, with EigenScore consistently outperforming others.
### Components/Axes
- **X-axis (Top-K)**: Discrete values at 3, 5, 10, 20, 30, 50.
- **Y-axis (AUROC)**: Scale from 40 to 90, with increments of 10.
- **Legend**: Located in the bottom-right corner, mapping:
- Blue crosses (×): Perplexity
- Gray diamonds (◆): LN-Entropy
- Teal circles (●): Lexical Similarity
- Orange stars (★): EigenScore
### Detailed Analysis
1. **Perplexity (Blue ×)**:
- Flat line at ~65 AUROC across all Top-K values.
- No significant variation observed.
2. **LN-Entropy (Gray ◆)**:
- Slight upward trend from ~67 (Top-K=3) to ~69 (Top-K=50).
- Minimal fluctuation between intermediate Top-K values.
3. **Lexical Similarity (Teal ●)**:
- Stable at ~75 AUROC for Top-K=3–20.
- Minor increase to ~76 at Top-K=50.
4. **EigenScore (Orange ★)**:
- Consistently highest performance (~80 AUROC) across all Top-K.
- Slight dip to ~79 at Top-K=10, then recovery to ~80.
### Key Observations
- **EigenScore** maintains the highest AUROC (79–80) regardless of Top-K, indicating robustness.
- **Perplexity** is the least sensitive metric, showing no change across Top-K.
- **LN-Entropy** exhibits the weakest sensitivity, with a marginal 2-point increase.
- **Lexical Similarity** remains stable until Top-K=50, where it marginally improves.
### Interpretation
The data suggests that **EigenScore** is the most reliable metric for evaluating model performance across varying Top-K configurations, as it consistently achieves the highest AUROC. **Perplexity** and **Lexical Similarity** demonstrate stability but lower performance, while **LN-Entropy** shows minimal sensitivity. The flat trends imply that Top-K adjustments have limited impact on these metrics, though EigenScore’s slight dip at Top-K=10 warrants further investigation into potential anomalies. This analysis is critical for optimizing model evaluation strategies in natural language processing tasks.