\n
## Heatmaps: Key Distribution with Varying Buckets
### Overview
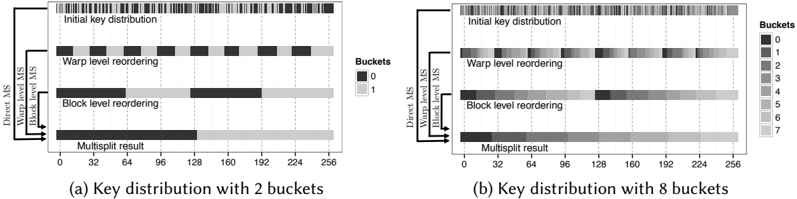
The image presents two heatmaps, labeled (a) and (b), illustrating the distribution of keys across different processing stages. Both heatmaps visualize the effect of various reordering techniques (Direct MS, Warp Level MS, Block Level MS, and Multisplit) on an initial key distribution. Heatmap (a) uses 2 buckets, while heatmap (b) uses 8 buckets for representing the key distribution. The intensity of the color represents the density of keys within each bucket at each processing stage.
### Components/Axes
Both heatmaps share the following components:
* **Y-axis:** Represents the processing stages: "Initial key distribution", "Warp level reordering", "Block level reordering", and "Multisplit result". The order is from top to bottom.
* **X-axis:** Represents the key values, ranging from 0 to 256. The scale is linear.
* **Color Scale/Legend:**
* **(a):** Two colors: Black (representing bucket 0) and White (representing bucket 1).
* **(b):** Eight colors, ranging from Black to White, representing buckets 0 through 7.
* **Labels:** Each heatmap is labeled with "(a) Key distribution with 2 buckets" and "(b) Key distribution with 8 buckets" respectively.
### Detailed Analysis or Content Details
**Heatmap (a) - 2 Buckets:**
* **Initial key distribution:** The keys are heavily concentrated towards the lower end of the range (0-64), primarily in bucket 0 (black). There's a small presence of bucket 1 (white) towards the higher end (around 224-256).
* **Warp level reordering:** The distribution becomes more spread out, with bucket 0 (black) still dominant in the lower range (0-96) and bucket 1 (white) appearing more frequently in the upper range (96-256).
* **Block level reordering:** The distribution is further spread out. Bucket 0 (black) is present from 0-128, and bucket 1 (white) is present from 128-256.
* **Multisplit result:** The distribution is relatively uniform, with a mix of bucket 0 (black) and bucket 1 (white) across the entire range, though still slightly more concentrated towards the lower end.
**Heatmap (b) - 8 Buckets:**
* **Initial key distribution:** The keys are concentrated towards the lower end (0-64), with a gradient of buckets from 0 (black) to 2 (grey). Higher buckets (3-7) are sparsely present towards the upper end (224-256).
* **Warp level reordering:** The distribution becomes more spread out. Buckets 0-3 (black to light grey) are present in the lower range (0-128), and buckets 3-7 are present in the upper range (128-256).
* **Block level reordering:** The distribution is even more spread out. Buckets 0-5 are present in the lower range (0-192), and buckets 3-7 are present in the upper range (192-256).
* **Multisplit result:** The distribution is the most uniform, with all buckets (0-7) present across the entire range, though there's a slight gradient, with lower buckets being more prevalent in the lower range and higher buckets in the upper range.
### Key Observations
* As the processing stages progress, the key distribution becomes more uniform in both heatmaps.
* Increasing the number of buckets (from 2 to 8) reveals a more granular distribution of keys.
* The "Multisplit result" consistently demonstrates the most uniform distribution across all buckets.
* The initial key distribution is heavily skewed towards lower key values.
### Interpretation
These heatmaps demonstrate the effectiveness of different reordering techniques in distributing keys more evenly. The initial key distribution is highly non-uniform, which can lead to performance bottlenecks in parallel processing. The reordering techniques, particularly "Block level reordering" and "Multisplit result", aim to mitigate this issue by spreading the keys across a wider range of buckets.
The transition from 2 buckets to 8 buckets provides a more detailed view of the distribution, revealing subtle differences in the effectiveness of each technique. The "Multisplit result" consistently achieves the most uniform distribution, suggesting it is the most effective method for balancing the workload across processing units.
The color gradients in heatmap (b) indicate that while the distribution is more uniform, there's still a slight bias towards lower key values, even after the reordering process. This suggests that further optimization might be possible to achieve a perfectly uniform distribution. The heatmaps provide a visual representation of how these techniques impact key distribution, which is crucial for understanding and optimizing parallel processing performance.