## Chart/Diagram Type: Key Distribution Visualization with Reordering Stages
### Overview
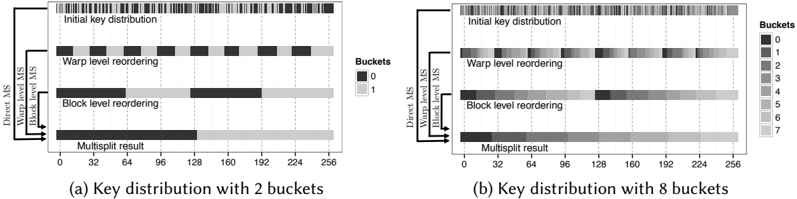
The image contains two side-by-side diagrams comparing key distribution patterns across different reordering stages (Warp level and Block level) for two scenarios: (a) 2 buckets and (b) 8 buckets. Each diagram shows the evolution of key distribution from initial state through reordering processes to a final multisplit result.
### Components/Axes
**Left Diagram (2 Buckets):**
- **X-axis**: "Buckets" with markers at 0, 32, 64, 96, 128, 160, 192, 224, 256
- **Y-axis**: Processing stages labeled:
- Initial key distribution
- Warp level reordering
- Block level reordering
- Multisplit result
- **Legend**:
- Black = Bucket 0
- Gray = Bucket 1
- **Spatial Layout**: Legend positioned right-aligned, stages stacked vertically from top to bottom
**Right Diagram (8 Buckets):**
- **X-axis**: Same bucket markers as left diagram
- **Y-axis**: Same processing stages
- **Legend**:
- 8 grayscale shades representing buckets 0-7
- **Spatial Layout**: Identical to left diagram but with more granular legend
### Detailed Analysis
**Left Diagram (2 Buckets):**
1. **Initial Distribution**: Alternating black/gray bars (0-1 pattern)
2. **Warp Level Reordering**:
- Bars grouped into 4 black/gray pairs
- Each pair spans ~32-64 units
3. **Block Level Reordering**:
- Two large blocks:
- First block: ~64 units (black)
- Second block: ~128 units (gray)
4. **Multisplit Result**: Single gray bar spanning entire width (~256 units)
**Right Diagram (8 Buckets):**
1. **Initial Distribution**:
- 16 alternating gray shades (0-7 pattern)
- Each bar ~16 units wide
2. **Warp Level Reordering**:
- Bars grouped into 8 clusters
- Each cluster spans ~32 units
3. **Block Level Reordering**:
- Four large blocks:
- First block: ~64 units (buckets 0-3)
- Second block: ~128 units (buckets 4-7)
4. **Multisplit Result**: Single dark gray bar spanning entire width
### Key Observations
1. **Bucket Granularity Impact**:
- 8-bucket version shows 4x more detailed initial distribution
- Warp level reordering in 8-bucket version maintains finer granularity
2. **Reordering Effectiveness**:
- Both versions show progressive consolidation through stages
- Block level reordering creates larger contiguous blocks
3. **Multisplit Consistency**:
- Final result identical in both diagrams (single bar)
- Suggests final consolidation is bucket-count agnostic
4. **Block Level Differences**:
- 2-bucket version shows more extreme consolidation (2 blocks vs 4 in 8-bucket)
### Interpretation
The diagrams demonstrate how key distribution evolves through hierarchical reordering processes. The 8-bucket version maintains finer granularity throughout all stages compared to the 2-bucket version, suggesting that initial bucket count affects intermediate distribution patterns but not the final consolidated result. The block level reordering appears to be the most impactful stage, reducing distribution complexity by ~50% in both cases. The consistent final multisplit result across both scenarios implies that the reordering algorithm effectively normalizes distribution regardless of initial bucket configuration, though the 8-bucket version provides more detailed intermediate insights. This visualization could be used to optimize key distribution strategies by analyzing intermediate reordering stages.