# Technical Document Extraction: Image Analysis
## Overview
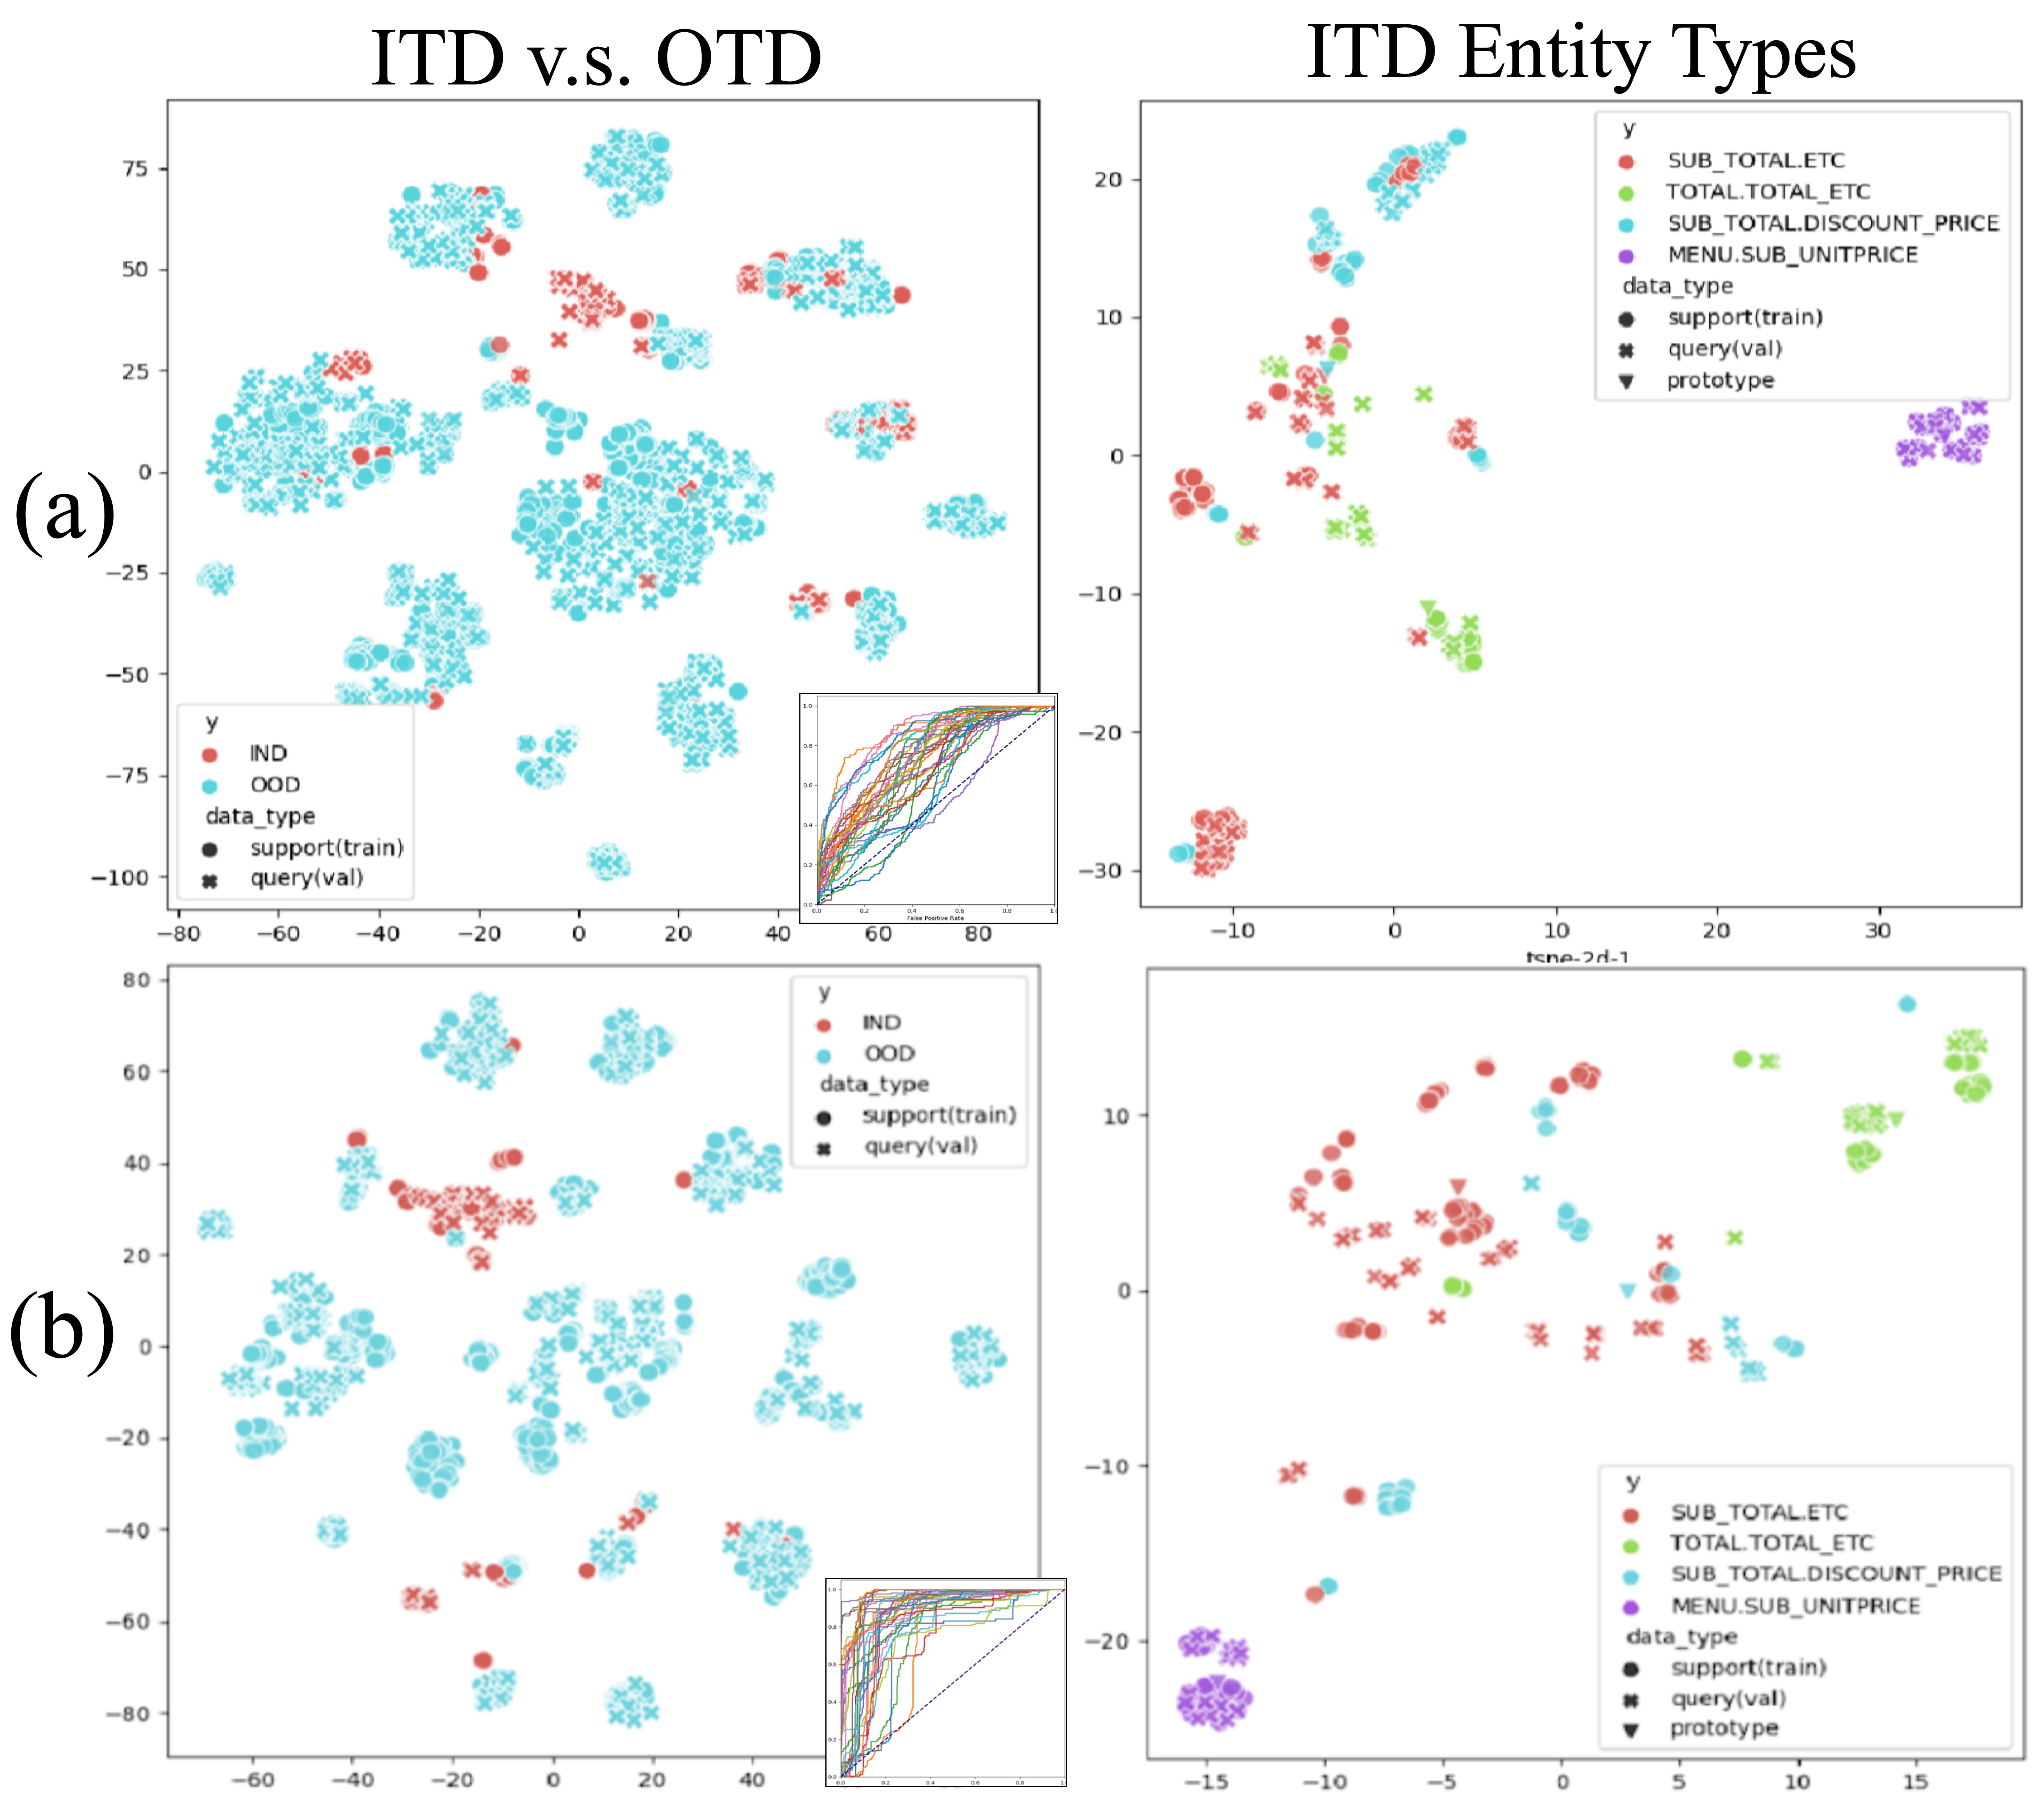
The image contains **four subplots** organized in a 2x2 grid, comparing **ITD (In-Distribution)** vs. **OTD (Out-Of-Distribution)** data distributions and entity types. Each subplot includes scatter plots, legends, and inset visualizations. Below is a detailed breakdown of textual and structural components.
---
## Subplot (a): ITD v.s. OTD
### Left Chart
- **Title**: "ITD v.s. OTD"
- **Legend**:
- **Red**: `IND` (In-Distribution)
- **Blue**: `OOD` (Out-Of-Distribution)
- **Axes**:
- **X-axis**: Numerical range from `-80` to `80`
- **Y-axis**: Numerical range from `-100` to `75`
- **Data Points**:
- Red (`IND`) and blue (`OOD`) clusters are spatially separated, with red concentrated in the upper-right quadrant and blue dispersed across the plot.
- **Inset Plot**:
- A small scatter plot with a diagonal dashed line (likely a reference line for correlation).
- Multiple colored lines (red, blue, green, etc.) representing data trends, but labels are illegible.
### Right Chart
- **Title**: "ITD Entity Types"
- **Legend**:
- **Red**: `SUB_TOTAL.ETC`
- **Green**: `TOTAL.TOTAL_ETC`
- **Blue**: `SUB_TOTAL.DISCOUNT_PRICE`
- **Purple**: `MENU.SUB_UNITPRICE`
- **Black**: `support(train)`
- **Black Star**: `query(val)`
- **Black Triangle**: `prototype`
- **Axes**:
- **X-axis**: `tsne-2d-1` (range: `-15` to `30`)
- **Y-axis**: `tsne-2d-2` (range: `-20` to `20`)
- **Data Points**:
- Red (`SUB_TOTAL.ETC`) and green (`TOTAL.TOTAL_ETC`) clusters dominate the upper-right quadrant.
- Purple (`MENU.SUB_UNITPRICE`) appears in the lower-left quadrant.
- Black stars (`query(val)`) and triangles (`prototype`) are sparsely distributed.
---
## Subplot (b): ITD Entity Types (Continued)
### Left Chart
- **Title**: "ITD v.s. OTD" (same as subplot (a), left)
- **Legend**: Identical to subplot (a), left.
- **Axes**: Same numerical ranges as subplot (a), left.
- **Data Points**:
- Similar spatial distribution to subplot (a), left, with red (`IND`) and blue (`OOD`) clusters.
### Right Chart
- **Title**: "ITD Entity Types" (same as subplot (a), right)
- **Legend**: Identical to subplot (a), right.
- **Axes**: Same `tsne-2d-1` and `tsne-2d-2` axes as subplot (a), right.
- **Data Points**:
- Additional purple (`MENU.SUB_UNITPRICE`) clusters in the lower-left quadrant.
- Increased density of black stars (`query(val)`) and triangles (`prototype`).
---
## Key Observations
1. **Legend Consistency**:
- Colors in legends match data points across all charts (e.g., red = `IND`, blue = `OOD`).
- Spatial grounding confirms legend placement (e.g., upper-right in subplot (a), lower-right in subplot (b)).
2. **Trend Verification**:
- **Subplot (a), Left**: Red (`IND`) points cluster tightly, while blue (`OOD`) points are more dispersed.
- **Subplot (a), Right**: Red (`SUB_TOTAL.ETC`) and green (`TOTAL.TOTAL_ETC`) form distinct clusters, suggesting entity-type separation.
- **Subplot (b), Right**: Purple (`MENU.SUB_UNITPRICE`) introduces a new cluster, indicating additional entity-type diversity.
3. **Inset Plots**:
- Likely represent dimensionality reduction (e.g., t-SNE) or correlation analysis, but details are unclear due to small size.
---
## Missing/Unclear Elements
- Numerical values for inset plot axes and lines.
- Specific data point counts or exact coordinates.
- Descriptions of line styles in inset plots (e.g., dashed vs. solid).
---
## Conclusion
The image visualizes **ITD vs. OTD data distributions** and **entity-type clustering** using t-SNE embeddings. Red (`IND`) and blue (`OOD`) points are spatially separated, while entity types (e.g., `SUB_TOTAL.ETC`, `MENU.SUB_UNITPRICE`) form distinct clusters. Legends are consistently placed and color-coded, aiding interpretation.