## Radar Charts: Data Selection, Test-Time Scaling, and Ablation Study
### Overview
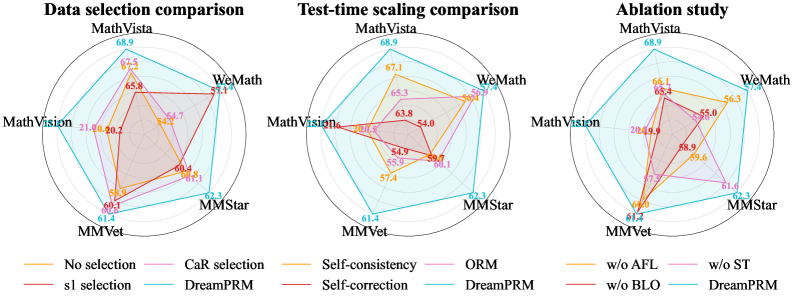
The image presents three radar charts comparing different methods related to data selection, test-time scaling, and ablation studies. Each chart visualizes the performance across five categories: MathVista, WeMath, MMStar, MMVet, and MathVision. Different colored lines represent different selection methods or ablation conditions.
### Components/Axes
* **Chart Titles (Top):**
* Left: "Data selection comparison"
* Center: "Test-time scaling comparison"
* Right: "Ablation study"
* **Axes (Radial):** The radial axes represent performance metrics, presumably accuracy or a similar measure. The scale ranges approximately from 20 to 70.
* **Categories (Around the Circle):**
* MathVista (Top)
* WeMath (Top-Right)
* MMStar (Bottom-Right)
* MMVet (Bottom-Left)
* MathVision (Top-Left)
* **Axis Markers:** Concentric circles indicate approximate values. The outermost circle corresponds to a value near 70, and the innermost circle corresponds to a value near 20.
* **Legends (Bottom):**
* **Left Chart (Data selection comparison):**
* Orange: No selection
* Pink: CaR selection
* Red: s1 selection
* Cyan: DreamPRM
* **Center Chart (Test-time scaling comparison):**
* Orange: Self-consistency
* Pink: ORM
* Red: Self-correction
* Cyan: DreamPRM
* **Right Chart (Ablation study):**
* Orange: w/o AFL
* Pink: w/o ST
* Red: w/o BLO
* Cyan: DreamPRM
### Detailed Analysis
#### Data selection comparison (Left Chart)
* **No selection (Orange):** The "No selection" line forms a pentagon.
* MathVista: ~67.5
* WeMath: ~65.8
* MMStar: ~60.4
* MMVet: ~60.1
* MathVision: ~20.2
* **CaR selection (Pink):** The "CaR selection" line forms a pentagon.
* MathVista: ~68.9
* WeMath: ~57.1
* MMStar: ~62.3
* MMVet: ~61.4
* MathVision: ~54.7
* **s1 selection (Red):** The "s1 selection" line forms a pentagon.
* MathVista: ~21.0
* WeMath: ~54.2
* MMStar: ~61.1
* MMVet: ~58.9
* MathVision: ~20.7
* **DreamPRM (Cyan):** The "DreamPRM" line forms a pentagon.
* MathVista: ~68.9
* WeMath: ~57.1
* MMStar: ~62.3
* MMVet: ~61.4
* MathVision: ~21.0
#### Test-time scaling comparison (Center Chart)
* **Self-consistency (Orange):** The "Self-consistency" line forms a pentagon.
* MathVista: ~67.1
* WeMath: ~65.3
* MMStar: ~59.7
* MMVet: ~57.4
* MathVision: ~63.8
* **ORM (Pink):** The "ORM" line forms a pentagon.
* MathVista: ~68.9
* WeMath: ~56.9
* MMStar: ~62.3
* MMVet: ~61.4
* MathVision: ~20.5
* **Self-correction (Red):** The "Self-correction" line forms a pentagon.
* MathVista: ~21.5
* WeMath: ~54.0
* MMStar: ~60.1
* MMVet: ~55.9
* MathVision: ~54.9
* **DreamPRM (Cyan):** The "DreamPRM" line forms a pentagon.
* MathVista: ~68.9
* WeMath: ~57.1
* MMStar: ~62.3
* MMVet: ~61.4
* MathVision: ~20.5
#### Ablation study (Right Chart)
* **w/o AFL (Orange):** The "w/o AFL" line forms a pentagon.
* MathVista: ~66.1
* WeMath: ~55.0
* MMStar: ~59.6
* MMVet: ~61.2
* MathVision: ~65.4
* **w/o ST (Pink):** The "w/o ST" line forms a pentagon.
* MathVista: ~68.9
* WeMath: ~56.3
* MMStar: ~61.6
* MMVet: ~61.2
* MathVision: ~19.9
* **w/o BLO (Red):** The "w/o BLO" line forms a pentagon.
* MathVista: ~20.4
* WeMath: ~56.0
* MMStar: ~61.0
* MMVet: ~57.3
* MathVision: ~49.9
* **DreamPRM (Cyan):** The "DreamPRM" line forms a pentagon.
* MathVista: ~68.9
* WeMath: ~57.4
* MMStar: ~62.3
* MMVet: ~61.4
* MathVision: ~20.4
### Key Observations
* **DreamPRM:** The "DreamPRM" method (cyan line) consistently achieves high performance on MathVista, WeMath, MMStar, and MMVet, but performs poorly on MathVision across all three charts.
* **MathVision Performance:** MathVision consistently shows the lowest performance for most methods, especially in the "Data selection comparison" and "Test-time scaling comparison" charts.
* **Ablation Impact:** Removing AFL ("w/o AFL") seems to have a more significant impact on MathVista and MathVision compared to removing ST ("w/o ST") or BLO ("w/o BLO").
### Interpretation
The radar charts provide a comparative analysis of different methods and their impact on performance across various categories. The consistent high performance of DreamPRM on most categories suggests its robustness, while its poor performance on MathVision indicates a potential limitation or bias. The ablation study highlights the importance of AFL for MathVista and MathVision, suggesting that AFL plays a crucial role in these categories. The data suggests that the choice of data selection method, test-time scaling technique, and ablation conditions can significantly impact performance, and the optimal choice may depend on the specific category being considered.