\n
## Radar Charts: Performance Comparison of Math Problem Solving Techniques
### Overview
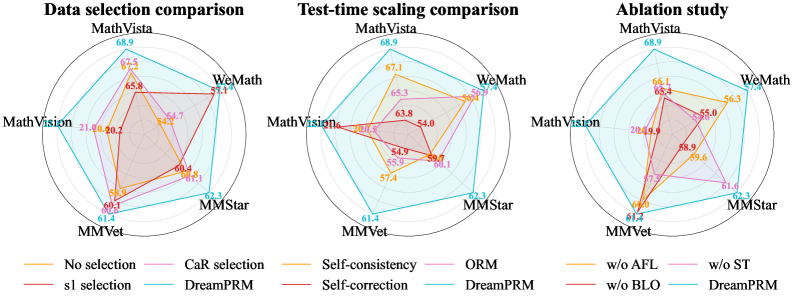
The image presents three radar charts comparing the performance of different techniques for solving math problems across four datasets: MathVista, MathVision, WeMath, and MMStar/MMVet. Each chart focuses on a different aspect of the comparison: data selection, test-time scaling, and ablation study. The performance is measured on a scale from approximately 0 to 70, indicated by the radial axis.
### Components/Axes
Each chart shares the following components:
* **Radial Axes:** Representing the four datasets: MathVista, MathVision, WeMath, and MMStar/MMVet. These are positioned equidistantly around the center of the chart.
* **Radial Scale:** A scale from 0 to 70, marked at intervals of approximately 10, indicating performance scores.
* **Lines:** Each line represents a different technique or configuration.
* **Legends:** Located at the bottom of each chart, identifying the color-coded lines.
The three charts have different titles and legends:
* **Chart 1: Data selection comparison**
* Legend:
* Yellow: No selection
* Orange: sl selection
* Red: CaR selection
* Pink: DreamPRM
* Light Blue: Self-consistency
* **Chart 2: Test-time scaling comparison**
* Legend:
* Yellow: Self-consistency
* Orange: ORM
* Red: Self-correction
* Pink: DreamPRM
* Light Blue: No scaling
* **Chart 3: Ablation study**
* Legend:
* Yellow: w/o AFL
* Orange: w/o BLO
* Red: w/o ST
* Pink: DreamPRM
* Light Blue: w/o all
### Detailed Analysis or Content Details
**Chart 1: Data selection comparison**
* **MathVista:** "No selection" (yellow) shows approximately 68.9, "sl selection" (orange) shows approximately 62.3, "CaR selection" (red) shows approximately 45.8, "DreamPRM" (pink) shows approximately 54.7, and "Self-consistency" (light blue) shows approximately 61.4.
* **MathVision:** "No selection" (yellow) shows approximately 21.0, "sl selection" (orange) shows approximately 20.2, "CaR selection" (red) shows approximately 40.4, "DreamPRM" (pink) shows approximately 57.4, and "Self-consistency" (light blue) shows approximately 61.3.
* **WeMath:** "No selection" (yellow) shows approximately 61.4, "sl selection" (orange) shows approximately 52.3, "CaR selection" (red) shows approximately 59.7, "DreamPRM" (pink) shows approximately 66.1, and "Self-consistency" (light blue) shows approximately 64.2.
* **MMStar/MMVet:** "No selection" (yellow) shows approximately 61.3, "sl selection" (orange) shows approximately 62.3, "CaR selection" (red) shows approximately 61.4, "DreamPRM" (pink) shows approximately 61.4, and "Self-consistency" (light blue) shows approximately 61.4.
**Chart 2: Test-time scaling comparison**
* **MathVista:** "Self-consistency" (yellow) shows approximately 68.9, "ORM" (orange) shows approximately 63.8, "Self-correction" (red) shows approximately 54.0, "DreamPRM" (pink) shows approximately 59.9, and "No scaling" (light blue) shows approximately 57.4.
* **MathVision:** "Self-consistency" (yellow) shows approximately 21.0, "ORM" (orange) shows approximately 20.2, "Self-correction" (red) shows approximately 40.4, "DreamPRM" (pink) shows approximately 57.4, and "No scaling" (light blue) shows approximately 61.3.
* **WeMath:** "Self-consistency" (yellow) shows approximately 61.4, "ORM" (orange) shows approximately 52.3, "Self-correction" (red) shows approximately 59.7, "DreamPRM" (pink) shows approximately 66.1, and "No scaling" (light blue) shows approximately 64.2.
* **MMStar/MMVet:** "Self-consistency" (yellow) shows approximately 61.3, "ORM" (orange) shows approximately 62.3, "Self-correction" (red) shows approximately 61.4, "DreamPRM" (pink) shows approximately 61.4, and "No scaling" (light blue) shows approximately 61.4.
**Chart 3: Ablation study**
* **MathVista:** "w/o AFL" (yellow) shows approximately 68.9, "w/o BLO" (orange) shows approximately 66.1, "w/o ST" (red) shows approximately 55.3, "DreamPRM" (pink) shows approximately 64.2, and "w/o all" (light blue) shows approximately 61.4.
* **MathVision:** "w/o AFL" (yellow) shows approximately 20.4, "w/o BLO" (orange) shows approximately 20.2, "w/o ST" (red) shows approximately 40.4, "DreamPRM" (pink) shows approximately 57.4, and "w/o all" (light blue) shows approximately 61.3.
* **WeMath:** "w/o AFL" (yellow) shows approximately 61.4, "w/o BLO" (orange) shows approximately 52.3, "w/o ST" (red) shows approximately 59.7, "DreamPRM" (pink) shows approximately 66.1, and "w/o all" (light blue) shows approximately 64.2.
* **MMStar/MMVet:** "w/o AFL" (yellow) shows approximately 61.3, "w/o BLO" (orange) shows approximately 62.3, "w/o ST" (red) shows approximately 61.4, "DreamPRM" (pink) shows approximately 61.4, and "w/o all" (light blue) shows approximately 61.4.
### Key Observations
* In all three charts, "DreamPRM" consistently performs well across all datasets, often achieving the highest scores.
* The performance varies significantly across the datasets. MathVista and WeMath generally show higher scores than MathVision and MMStar/MMVet.
* The ablation study (Chart 3) suggests that removing AFL ("w/o AFL") has a minimal impact on performance, while removing ST ("w/o ST") significantly reduces performance.
### Interpretation
These radar charts provide a comparative analysis of different techniques for math problem solving. The consistent strong performance of "DreamPRM" suggests it is a robust and effective approach. The variations in performance across datasets indicate that the effectiveness of different techniques may depend on the characteristics of the math problems within each dataset. The ablation study highlights the importance of the ST component for achieving high performance. The charts demonstrate a clear visual representation of the trade-offs between different techniques and their impact on performance across various datasets. The data suggests that DreamPRM is a strong baseline, and further improvements may be achieved by focusing on optimizing the ST component.