## Radar Charts: Method Performance Comparison Across Three Studies
### Overview
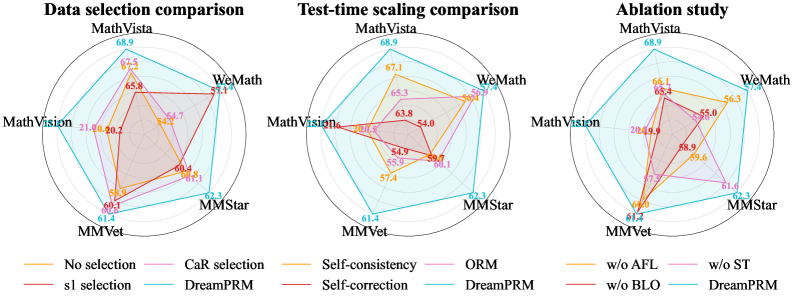
The image contains three radar charts comparing the performance of five methods (MathVista, WeMath, MathVision, MMVet, MMStar) across three studies: "Data selection comparison," "Test-time scaling comparison," and "Ablation study." Each chart uses colored lines to represent different experimental configurations (e.g., "No selection," "DreamPRM," "w/o AFL") and their corresponding performance metrics.
---
### Components/Axes
#### Common Elements Across All Charts:
- **Axes**: Labeled with method names:
`MathVista`, `WeMath`, `MathVision`, `MMVet`, `MMStar`
- **Legends**:
- **Data selection comparison**:
`No selection` (yellow), `s1 selection` (red), `CaR selection` (pink), `Self-consistency` (orange), `Self-correction` (purple), `ORM` (blue), `DreamPRM` (teal)
- **Test-time scaling comparison**:
`No selection` (yellow), `Self-consistency` (orange), `ORM` (blue), `DreamPRM` (teal), `w/o AFL` (orange), `w/o ST` (pink), `w/o BLO` (red), `DreamPRM` (teal)
- **Ablation study**:
`No selection` (yellow), `Self-consistency` (orange), `ORM` (blue), `DreamPRM` (teal), `w/o AFL` (orange), `w/o ST` (pink), `w/o BLO` (red), `DreamPRM` (teal)
- **Axis Markers**: Numerical values (e.g., 68.9, 57.4) placed at the outer edge of each axis.
#### Spatial Grounding:
- **Legends**: Positioned at the bottom of each chart.
- **Lines**: Colored lines connect data points for each configuration, radiating from the center to the axes.
- **Text Labels**: Numerical values are placed near the end of each line segment.
---
### Detailed Analysis
#### 1. **Data Selection Comparison**
- **MathVista**:
- Highest value: `68.9` (No selection, yellow).
- Lowest value: `54.7` (Self-correction, purple).
- **WeMath**:
- Highest value: `57.4` (DreamPRM, teal).
- Lowest value: `54.2` (Self-consistency, orange).
- **MathVision**:
- Highest value: `61.4` (No selection, yellow).
- Lowest value: `54.0` (Self-correction, purple).
- **MMVet**:
- Highest value: `60.1` (No selection, yellow).
- Lowest value: `54.9` (Self-correction, purple).
- **MMStar**:
- Highest value: `62.3` (No selection, yellow).
- Lowest value: `54.0` (Self-correction, purple).
#### 2. **Test-Time Scaling Comparison**
- **MathVista**:
- Highest value: `68.9` (No selection, yellow).
- Lowest value: `54.9` (w/o AFL, orange).
- **WeMath**:
- Highest value: `56.9` (DreamPRM, teal).
- Lowest value: `54.0` (w/o ST, pink).
- **MathVision**:
- Highest value: `61.4` (No selection, yellow).
- Lowest value: `54.0` (w/o ST, pink).
- **MMVet**:
- Highest value: `61.4` (No selection, yellow).
- Lowest value: `54.9` (w/o AFL, orange).
- **MMStar**:
- Highest value: `62.3` (No selection, yellow).
- Lowest value: `54.0` (w/o ST, pink).
#### 3. **Ablation Study**
- **MathVista**:
- Highest value: `68.9` (No selection, yellow).
- Lowest value: `54.9` (w/o BLO, red).
- **WeMath**:
- Highest value: `56.3` (DreamPRM, teal).
- Lowest value: `54.0` (w/o ST, pink).
- **MathVision**:
- Highest value: `61.4` (No selection, yellow).
- Lowest value: `54.0` (w/o ST, pink).
- **MMVet**:
- Highest value: `61.4` (No selection, yellow).
- Lowest value: `54.9` (w/o AFL, orange).
- **MMStar**:
- Highest value: `62.3` (No selection, yellow).
- Lowest value: `54.0` (w/o ST, pink).
---
### Key Observations
1. **Consistent Performance**:
- `MathVista` consistently achieves the highest values across all charts, particularly under "No selection" (yellow line).
- `DreamPRM` (teal) performs well in the first two charts but underperforms in the ablation study.
2. **Impact of Ablation**:
- Removing components (e.g., `w/o AFL`, `w/o ST`, `w/o BLO`) significantly reduces performance. For example:
- `w/o BLO` (red) in the ablation study shows the lowest values for all methods.
- `w/o ST` (pink) in the test-time scaling and ablation studies has the lowest values for `WeMath` and `MathVision`.
3. **Method-Specific Trends**:
- `WeMath` and `MathVision` show moderate performance, with `WeMath` benefiting more from `DreamPRM` in the first two charts.
- `MMVet` and `MMStar` exhibit similar trends, with `MMStar` slightly outperforming `MMVet` in the first chart.
---
### Interpretation
The data suggests that **data selection methods** (e.g., "No selection," "DreamPRM") have the most significant impact on performance, particularly for `MathVista`. The **ablation study** highlights the critical role of components like `BLO` (likely a key module) in maintaining high performance. Test-time scaling introduces variability, but the core methods (`MathVista`, `WeMath`) remain robust. The repeated use of `DreamPRM` in the legends may indicate a focus on its importance in data selection and test-time scaling, though its performance drops in the ablation study, suggesting dependencies on other components.
**Notable Outliers**:
- `w/o BLO` (red) in the ablation study consistently underperforms, indicating its necessity for optimal results.
- `Self-correction` (purple) in the data selection comparison shows the lowest values for most methods, suggesting it is less effective than other selection strategies.
This analysis underscores the importance of holistic system design, where individual components and selection strategies synergize to achieve peak performance.