## Chart Type: Line Graphs of Current vs. Normalized Error
### Overview
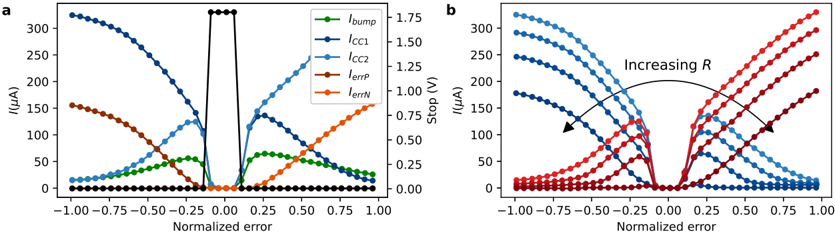
The image contains two line graphs, labeled 'a' and 'b', displaying the relationship between current (I, in μA) and normalized error. Graph 'a' shows the current of different components (I_bump, I_CC1, I_CC2, I_errP, I_errN) as a function of normalized error. Graph 'b' shows the current as a function of normalized error for different values of R, with an arrow indicating increasing R.
### Components/Axes
**Graph a:**
* **X-axis:** Normalized error, ranging from -1.00 to 1.00 in increments of 0.25.
* **Y-axis (left):** I (μA), ranging from 0 to 300 in increments of 50.
* **Y-axis (right):** Stop (V), ranging from 0.00 to 1.75 in increments of 0.25.
* **Legend (top-right):**
* Green: I_bump
* Dark Blue: I_CC1
* Light Blue: I_CC2
* Brown: I_errP
* Orange: I_errN
**Graph b:**
* **X-axis:** Normalized error, ranging from -1.00 to 1.00 in increments of 0.25.
* **Y-axis:** I (μA), ranging from 0 to 300 in increments of 50.
* **Arrow:** Indicates "Increasing R" from top-left to bottom-right.
* **Data Series:** A family of curves ranging from dark blue to dark red, representing different values of R.
### Detailed Analysis
**Graph a:**
* **I_bump (Green):** Starts near 0 μA at normalized error -1.00, increases to approximately 60 μA around -0.25, sharply drops to 0 μA at 0.00, and then increases again to approximately 60 μA at 0.25, before decreasing back to near 0 μA at 1.00.
* **I_CC1 (Dark Blue):** Starts at approximately 330 μA at normalized error -1.00, decreases steadily to approximately 10 μA at 0.00, and remains near 10 μA until 1.00.
* **I_CC2 (Light Blue):** Starts near 0 μA at normalized error -1.00, increases steadily to approximately 130 μA at 0.00, and continues to increase to approximately 150 μA at 1.00.
* **I_errP (Brown):** Starts at approximately 160 μA at normalized error -1.00, decreases steadily to approximately 0 μA at 0.00, and remains near 0 μA until 1.00.
* **I_errN (Orange):** Starts near 0 μA at normalized error -1.00, remains near 0 μA until 0.00, and then increases steadily to approximately 80 μA at 1.00.
**Graph b:**
* The curves transition from dark blue to dark red, representing increasing values of R.
* The dark blue curves start at high current values (approximately 300 μA) at normalized error -1.00 and decrease to near 0 μA at 0.00, remaining near 0 μA until 1.00.
* The dark red curves start near 0 μA at normalized error -1.00, remain near 0 μA until 0.00, and then increase to higher current values (approximately 180 μA) at 1.00.
* As R increases (from blue to red), the current at negative normalized error values decreases, and the current at positive normalized error values increases.
### Key Observations
* In graph 'a', I_bump peaks around normalized error values of -0.25 and 0.25. I_CC1 and I_errP decrease as normalized error increases, while I_CC2 and I_errN increase.
* In graph 'b', increasing R causes a shift in the current distribution. Higher R values result in lower current for negative normalized errors and higher current for positive normalized errors.
### Interpretation
The graphs illustrate how different current components and overall current behavior change with respect to normalized error and the parameter R. Graph 'a' shows the individual contributions of different current components, highlighting their behavior around the zero normalized error point. Graph 'b' demonstrates how the overall current profile is modulated by the value of R, suggesting that R influences the system's response to positive and negative errors. The data suggests a balancing or switching mechanism controlled by the normalized error and modulated by the parameter R.