## Line Graphs: Current and Voltage Response to Normalized Error
### Overview
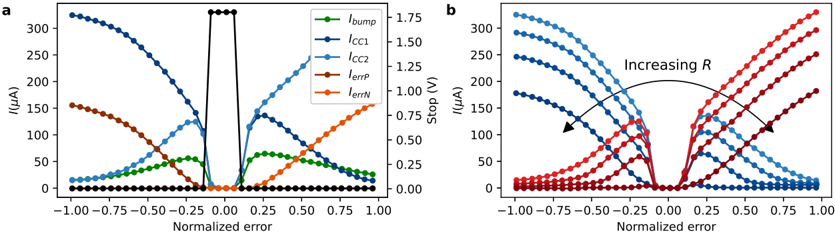
The image contains two panels (a and b) depicting line graphs that analyze electrical responses to normalized error. Panel a shows current (I) responses across different error values, while Panel b illustrates voltage (Stop) responses with increasing resistance (R). Both graphs use normalized error (-1.00 to 1.00) on the x-axis and current/voltage on the y-axis.
### Components/Axes
**Panel a:**
- **X-axis**: Normalized error (-1.00 to 1.00)
- **Y-axis**: Current (I) in microamperes (μA) (0–300)
- **Legend**: Located on the right, with five data series:
- Green: I_bump
- Dark blue: I_CC1
- Light blue: I_CC2
- Red: I_errP
- Orange: I_errN
**Panel b:**
- **X-axis**: Normalized error (-1.00 to 1.00)
- **Y-axis**: Stop voltage (V) (0–300)
- **Legend**: Gradient from blue (low R) to red (high R), labeled "Increasing R"
- **Arrow**: Indicates direction of increasing R (left to right)
### Detailed Analysis
**Panel a Trends:**
1. **I_bump (green)**: Sharp peak at 0 error (~300 μA), rapidly declining to ~50 μA at ±0.5 error.
2. **I_CC1 (dark blue)**: Broad peak centered at 0 error (~250 μA), tapering to ~100 μA at ±0.75 error.
3. **I_CC2 (light blue)**: Similar to I_CC1 but slightly lower amplitude (~200 μA at 0 error).
4. **I_errP (red)**: Linear increase from 0 μA at 0 error to ~150 μA at -1.00 error.
5. **I_errN (orange)**: Linear increase from 0 μA at 0 error to ~150 μA at +1.00 error.
**Panel b Trends:**
- Gradient lines (blue to red) show:
- **Low R (blue)**: Shallow slope, minimal voltage change (~50 V at ±1.00 error).
- **Medium R (purple)**: Moderate slope, ~150 V at ±1.00 error.
- **High R (red)**: Steep slope, ~250 V at ±1.00 error.
- All lines converge at 0 error (0 V).
### Key Observations
1. **Panel a**:
- I_bump exhibits a distinct peak at 0 error, suggesting a critical threshold response.
- I_errP and I_errN show symmetric linear behavior on negative/positive error sides.
- I_CC1 and I_CC2 have overlapping but distinct peak profiles.
2. **Panel b**:
- Voltage response steepens with increasing R, indicating resistance-dependent sensitivity to error.
- All lines intersect at 0 error (0 V), implying baseline stability at zero error.
### Interpretation
- **Panel a** likely represents current contributions from different error sources (e.g., bump current, cross-coupling currents, and error-driven currents). The sharp I_bump peak may indicate a dominant mechanism at zero error.
- **Panel b** demonstrates that higher resistance (R) amplifies the system's voltage response to error, suggesting R modulates error sensitivity. The convergence at 0 error implies error-free conditions stabilize the system regardless of R.
- The opposing slopes in Panel b (negative/positive error) may reflect asymmetric error impacts under varying resistance, critical for designing error-tolerant systems.