## Line Charts: Performance Comparison on Various Tasks
### Overview
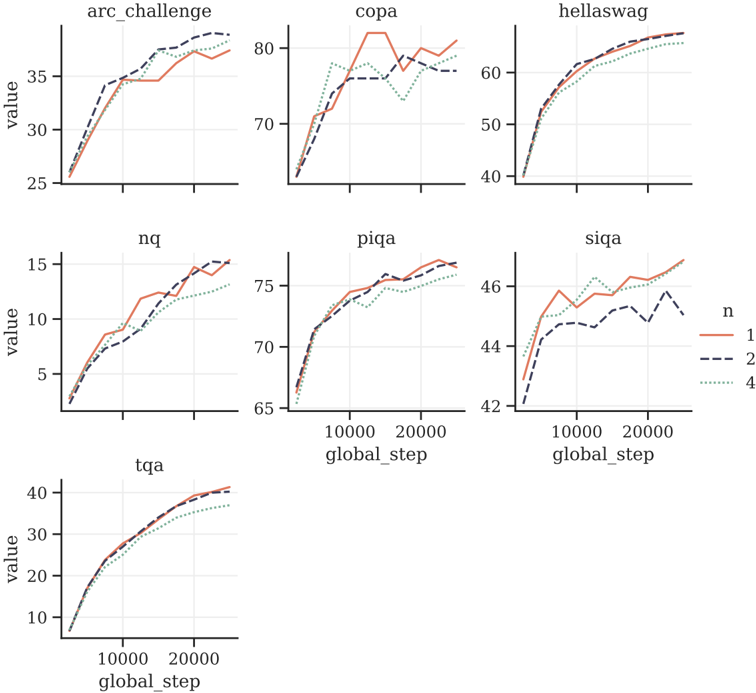
The image presents a series of line charts comparing the performance of a model across different tasks ("arc_challenge", "copa", "hellaswag", "nq", "piqa", "siqa", and "tqa") with varying configurations denoted by 'n' (1, 2, and 4). The charts display the 'value' (likely representing a performance metric) against the 'global_step' (training progress).
### Components/Axes
* **X-axis:** 'global_step', ranging from approximately 0 to 20000, with a marked value at 10000.
* **Y-axis:** 'value', with varying ranges depending on the task:
* arc_challenge: 25 to 35
* copa: 70 to 80
* hellaswag: 40 to 60
* nq: 5 to 15
* piqa: 65 to 75
* siqa: 42 to 46
* tqa: 10 to 40
* **Legend (bottom-right):**
* Solid Red Line: n = 1
* Dashed Black Line: n = 2
* Dotted Teal Line: n = 4
### Detailed Analysis
**1. arc_challenge:**
* **n = 1 (Solid Red):** Starts at approximately 25, increases to around 37 by global_step 10000, then plateaus and slightly decreases to approximately 36 by global_step 20000.
* **n = 2 (Dashed Black):** Starts at approximately 25, increases to around 35 by global_step 10000, then plateaus and slightly decreases to approximately 34 by global_step 20000.
* **n = 4 (Dotted Teal):** Starts at approximately 25, increases to around 34 by global_step 10000, then plateaus and slightly increases to approximately 37 by global_step 20000.
**2. copa:**
* **n = 1 (Solid Red):** Starts at approximately 70, increases to around 82 by global_step 10000, then fluctuates and ends at approximately 79 by global_step 20000.
* **n = 2 (Dashed Black):** Starts at approximately 70, increases to around 78 by global_step 10000, then fluctuates and ends at approximately 77 by global_step 20000.
* **n = 4 (Dotted Teal):** Starts at approximately 70, increases to around 78 by global_step 10000, then fluctuates and ends at approximately 76 by global_step 20000.
**3. hellaswag:**
* **n = 1 (Solid Red):** Starts at approximately 40, increases to around 62 by global_step 20000.
* **n = 2 (Dashed Black):** Starts at approximately 40, increases to around 61 by global_step 20000.
* **n = 4 (Dotted Teal):** Starts at approximately 40, increases to around 60 by global_step 20000.
**4. nq:**
* **n = 1 (Solid Red):** Starts at approximately 2, increases to around 15 by global_step 20000.
* **n = 2 (Dashed Black):** Starts at approximately 2, increases to around 14 by global_step 20000.
* **n = 4 (Dotted Teal):** Starts at approximately 2, increases to around 13 by global_step 20000.
**5. piqa:**
* **n = 1 (Solid Red):** Starts at approximately 67, increases to around 76 by global_step 20000.
* **n = 2 (Dashed Black):** Starts at approximately 67, increases to around 75 by global_step 20000.
* **n = 4 (Dotted Teal):** Starts at approximately 67, increases to around 76 by global_step 20000.
**6. siqa:**
* **n = 1 (Solid Red):** Starts at approximately 42, increases to around 47 by global_step 20000.
* **n = 2 (Dashed Black):** Starts at approximately 42, increases to around 46 by global_step 20000.
* **n = 4 (Dotted Teal):** Starts at approximately 42, increases to around 47 by global_step 20000.
**7. tqa:**
* **n = 1 (Solid Red):** Starts at approximately 10, increases to around 40 by global_step 20000.
* **n = 2 (Dashed Black):** Starts at approximately 10, increases to around 39 by global_step 20000.
* **n = 4 (Dotted Teal):** Starts at approximately 10, increases to around 38 by global_step 20000.
### Key Observations
* Across all tasks, the 'value' generally increases with the 'global_step', indicating learning or improvement over time.
* The performance differences between n=1, n=2, and n=4 are task-dependent. In some tasks (e.g., 'arc_challenge', 'copa'), the performance fluctuates after a certain point.
* The 'copa' task shows the most fluctuation in performance after the initial increase.
### Interpretation
The charts illustrate the impact of different configurations ('n') on the performance of a model across various tasks. The 'global_step' represents the training progress, and the 'value' likely represents a performance metric such as accuracy or score. The trends suggest that the model generally improves with training, but the optimal configuration ('n') may vary depending on the specific task. The fluctuations in performance for some tasks after a certain point could indicate overfitting or the need for further optimization. The parameter 'n' could represent the number of layers in a neural network, or the number of attention heads.